Fig. 3.
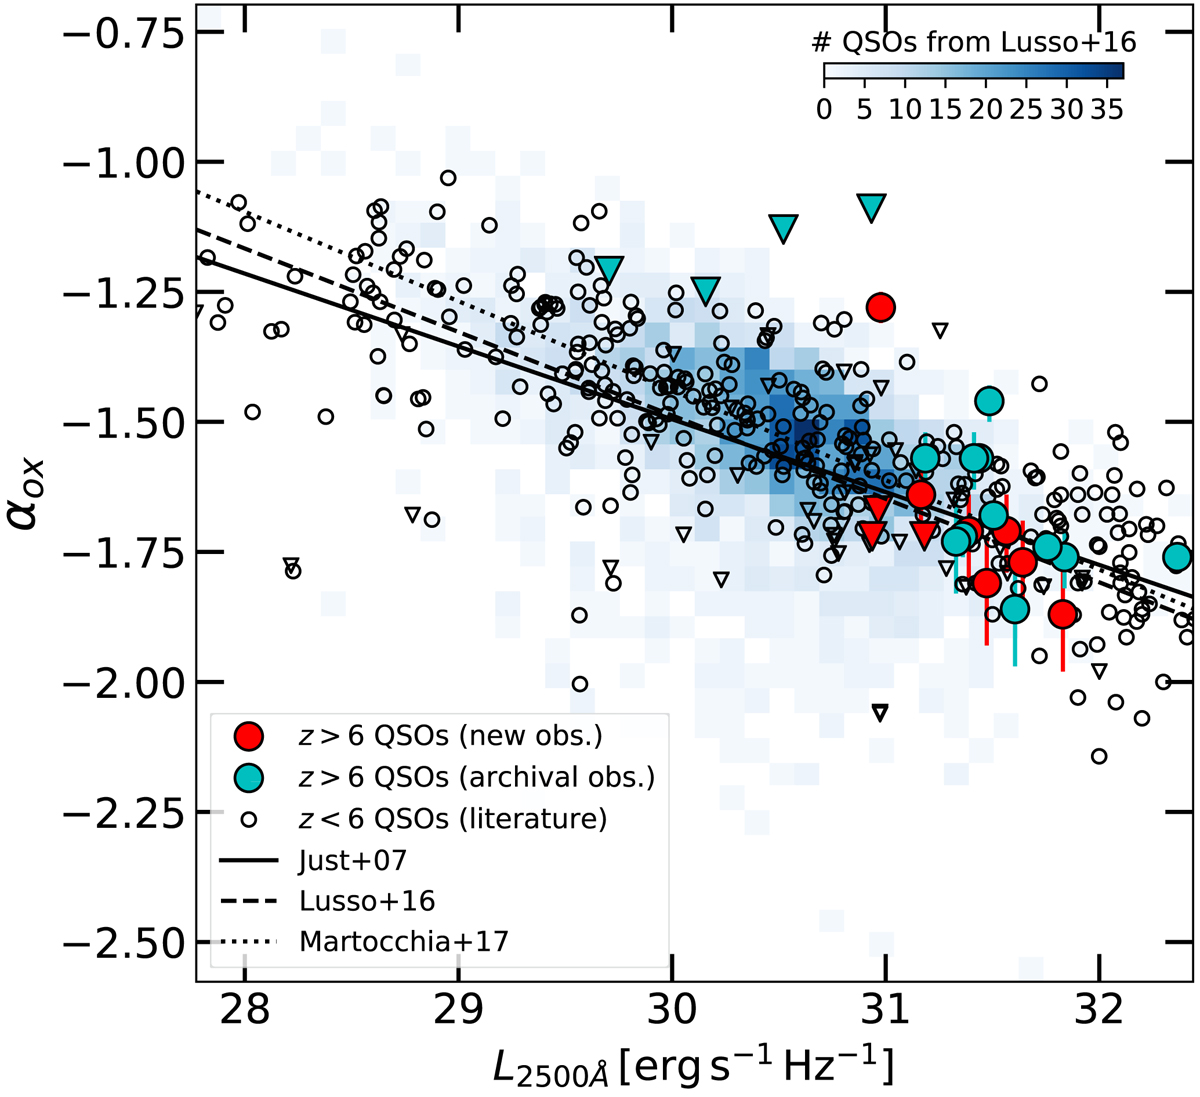
αox vs. L2500 Å for z ≥ 6 QSOs. We compared our results with a compilation of optically selected QSOs at lower redshifts (Shemmer et al. 2006a; Steffen et al. 2006; Just et al. 2007; Lusso & Risaliti 2016). Downward pointing triangles represent upper limits. We also show the best-fitting relations of Just et al. (2007), Lusso & Risaliti (2016), and Martocchia et al. (2017). For visual purposes, we do not plot X-ray undetected sources included in the Lusso & Risaliti (2016) sample.
Current usage metrics show cumulative count of Article Views (full-text article views including HTML views, PDF and ePub downloads, according to the available data) and Abstracts Views on Vision4Press platform.
Data correspond to usage on the plateform after 2015. The current usage metrics is available 48-96 hours after online publication and is updated daily on week days.
Initial download of the metrics may take a while.