Fig. 2.
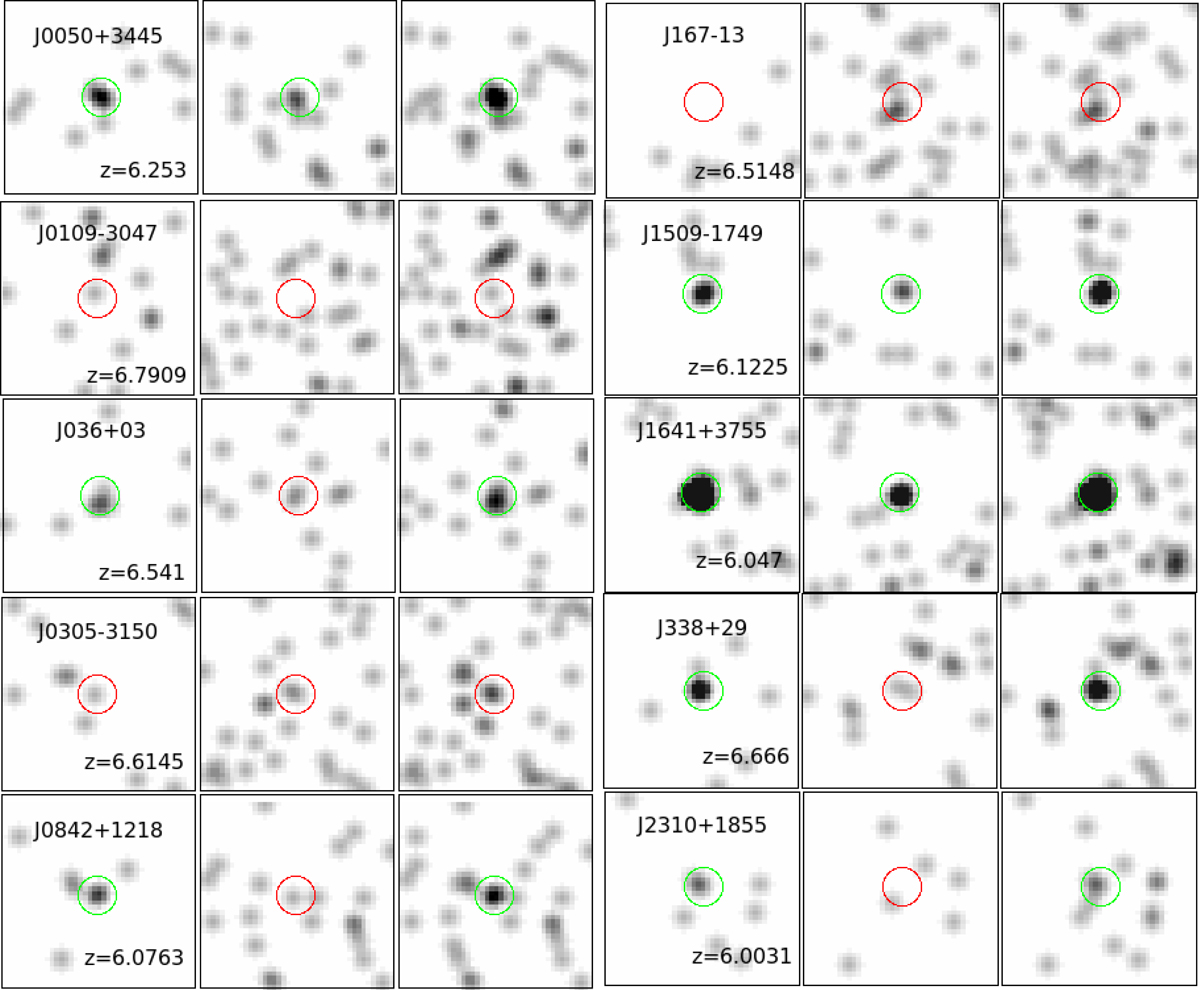
Smoothed Chandra images (40 × 40 pixels; i.e., ≈20″ × 20″) of our ten new targets (rows, as annotated) in soft (first column), hard (second column), and full (third column) band. Circles represent the source extraction regions (R = 2 arcsec) centered on the optical positions of the targets, and used to compute source photometry. Green and red circles are used for detected and undetected sources, respectively.
Current usage metrics show cumulative count of Article Views (full-text article views including HTML views, PDF and ePub downloads, according to the available data) and Abstracts Views on Vision4Press platform.
Data correspond to usage on the plateform after 2015. The current usage metrics is available 48-96 hours after online publication and is updated daily on week days.
Initial download of the metrics may take a while.