Fig. 1.
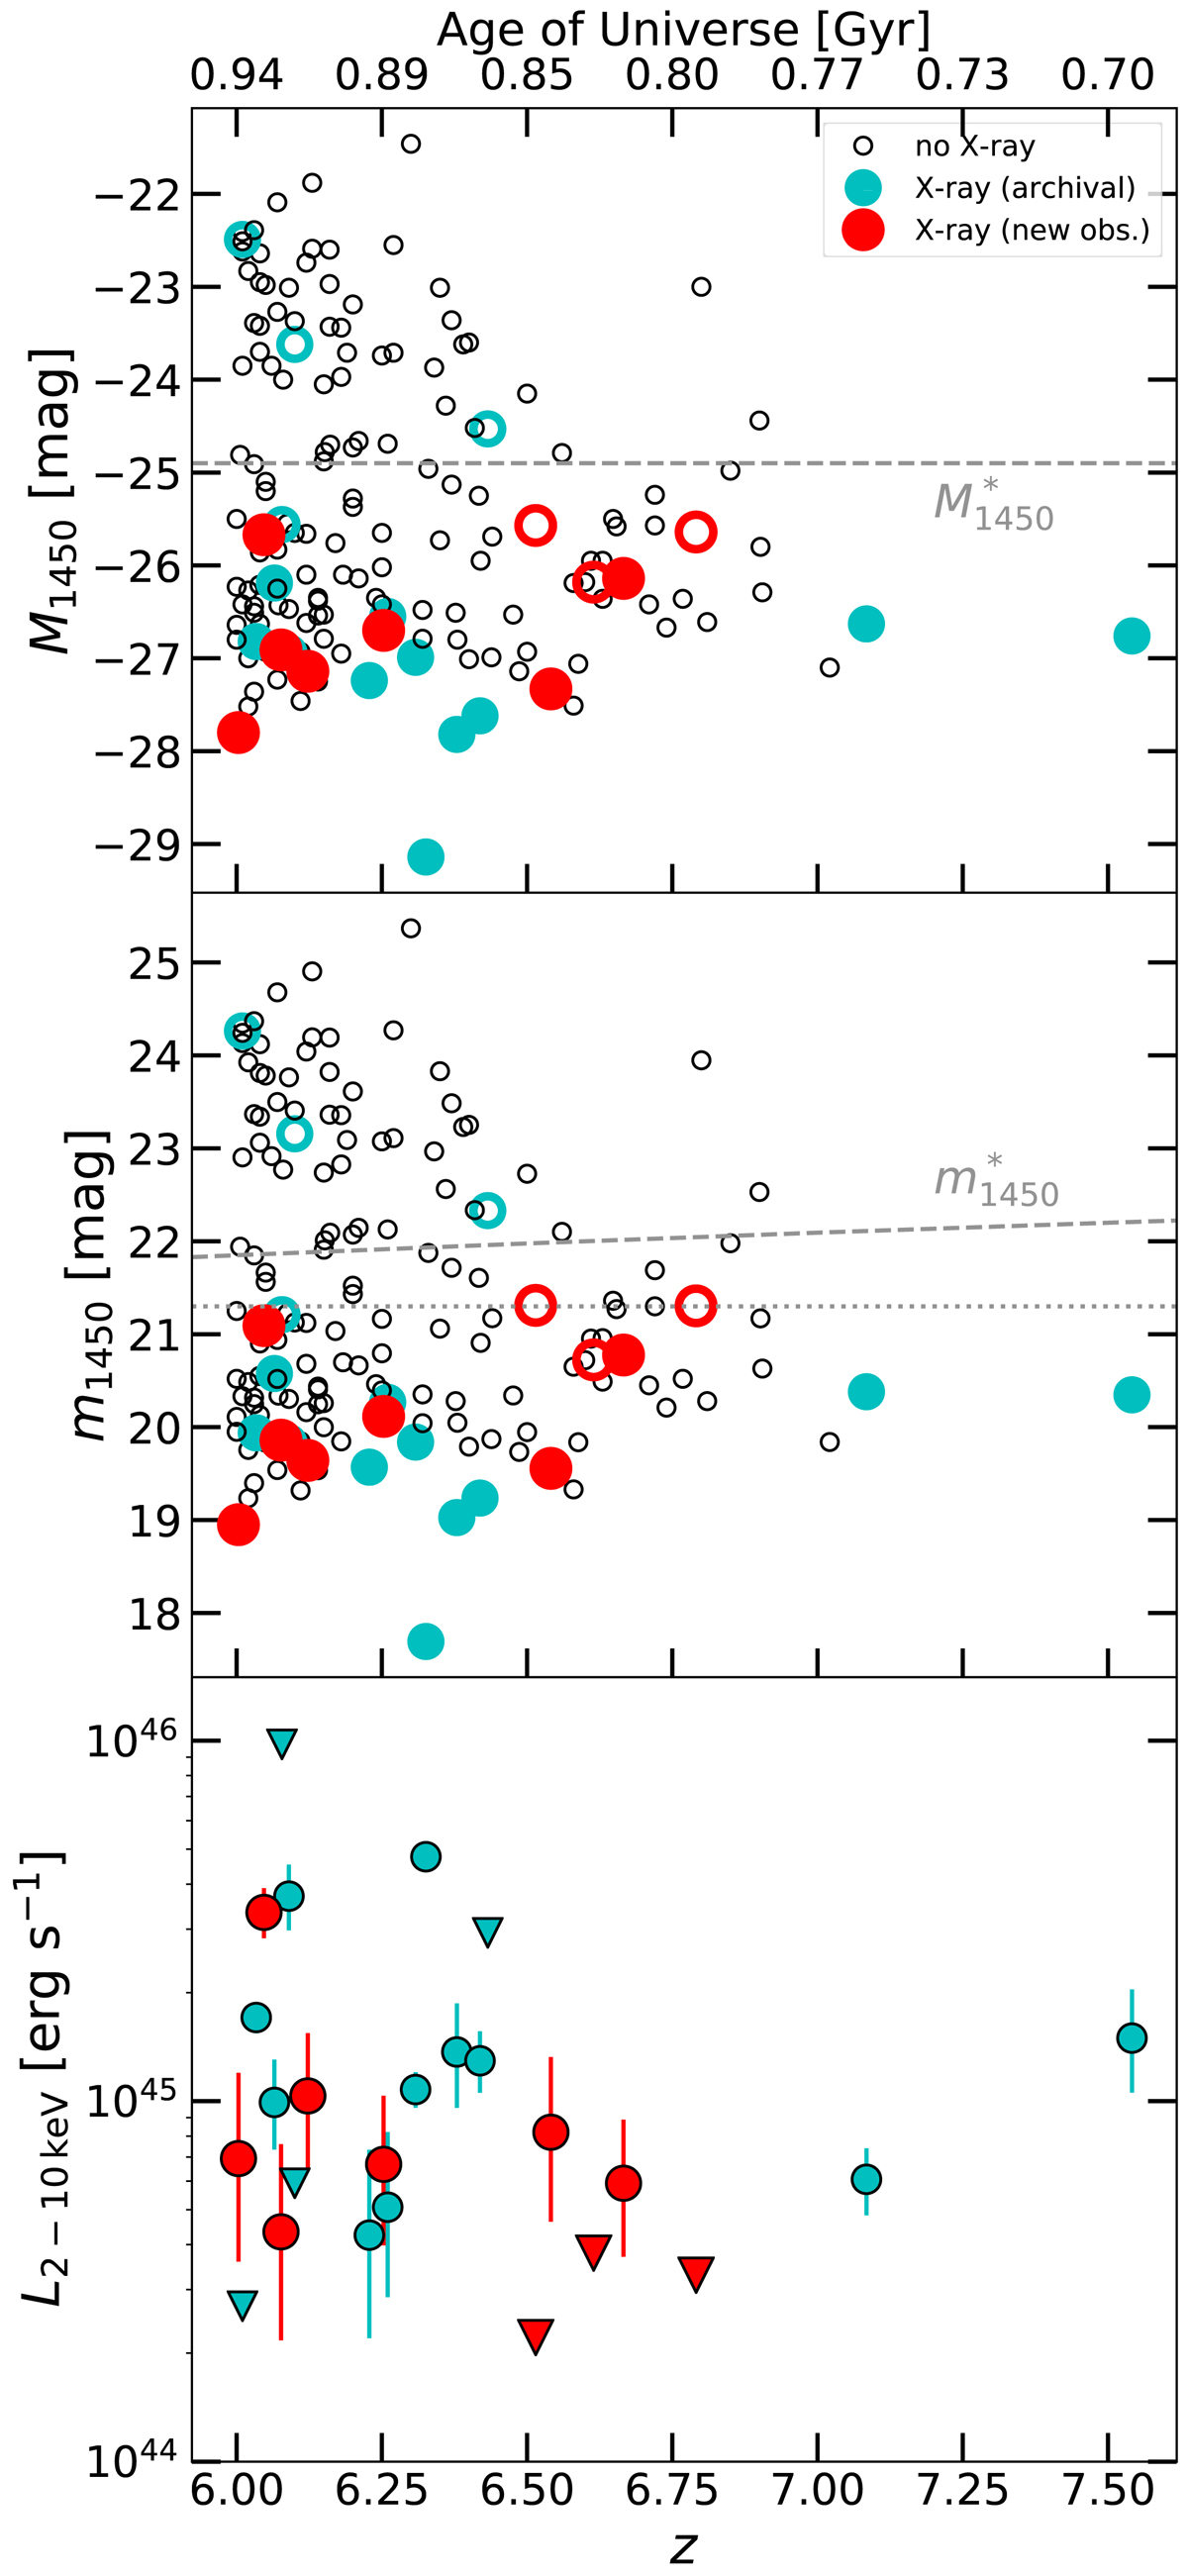
Top and middle panels: distribution of M1450 Å and m1450 Å as function of redshift. Small black open circles are QSOs not covered by X-ray observations (Bañados et al. 2016; Mazzucchelli et al. 2017; Reed et al. 2017; Tang et al. 2017; Wang et al. 2017, 2018a,b; Chehade et al. 2018; Matsuoka et al. 2018b,a; Yang et al. 2019). Cyan symbols are QSOs with archival X-ray data (see Table 1). Red symbols are QSOs covered by the new X-ray observations presented in this work. Filled symbols are X-ray detected, open symbols are not detected. Dashed lines represent the break magnitudes of the QSO luminosity function (Matsuoka et al. 2018c). The dotted line represents our magnitude selection. Bottom panel: X-ray luminosity (derived as described in Sect. 3) as a function of redshift. Symbols are the same as above, but upper limits on X-ray luminosity for undetected QSOs are shown as downward-pointing triangles.
Current usage metrics show cumulative count of Article Views (full-text article views including HTML views, PDF and ePub downloads, according to the available data) and Abstracts Views on Vision4Press platform.
Data correspond to usage on the plateform after 2015. The current usage metrics is available 48-96 hours after online publication and is updated daily on week days.
Initial download of the metrics may take a while.