Fig. 5.
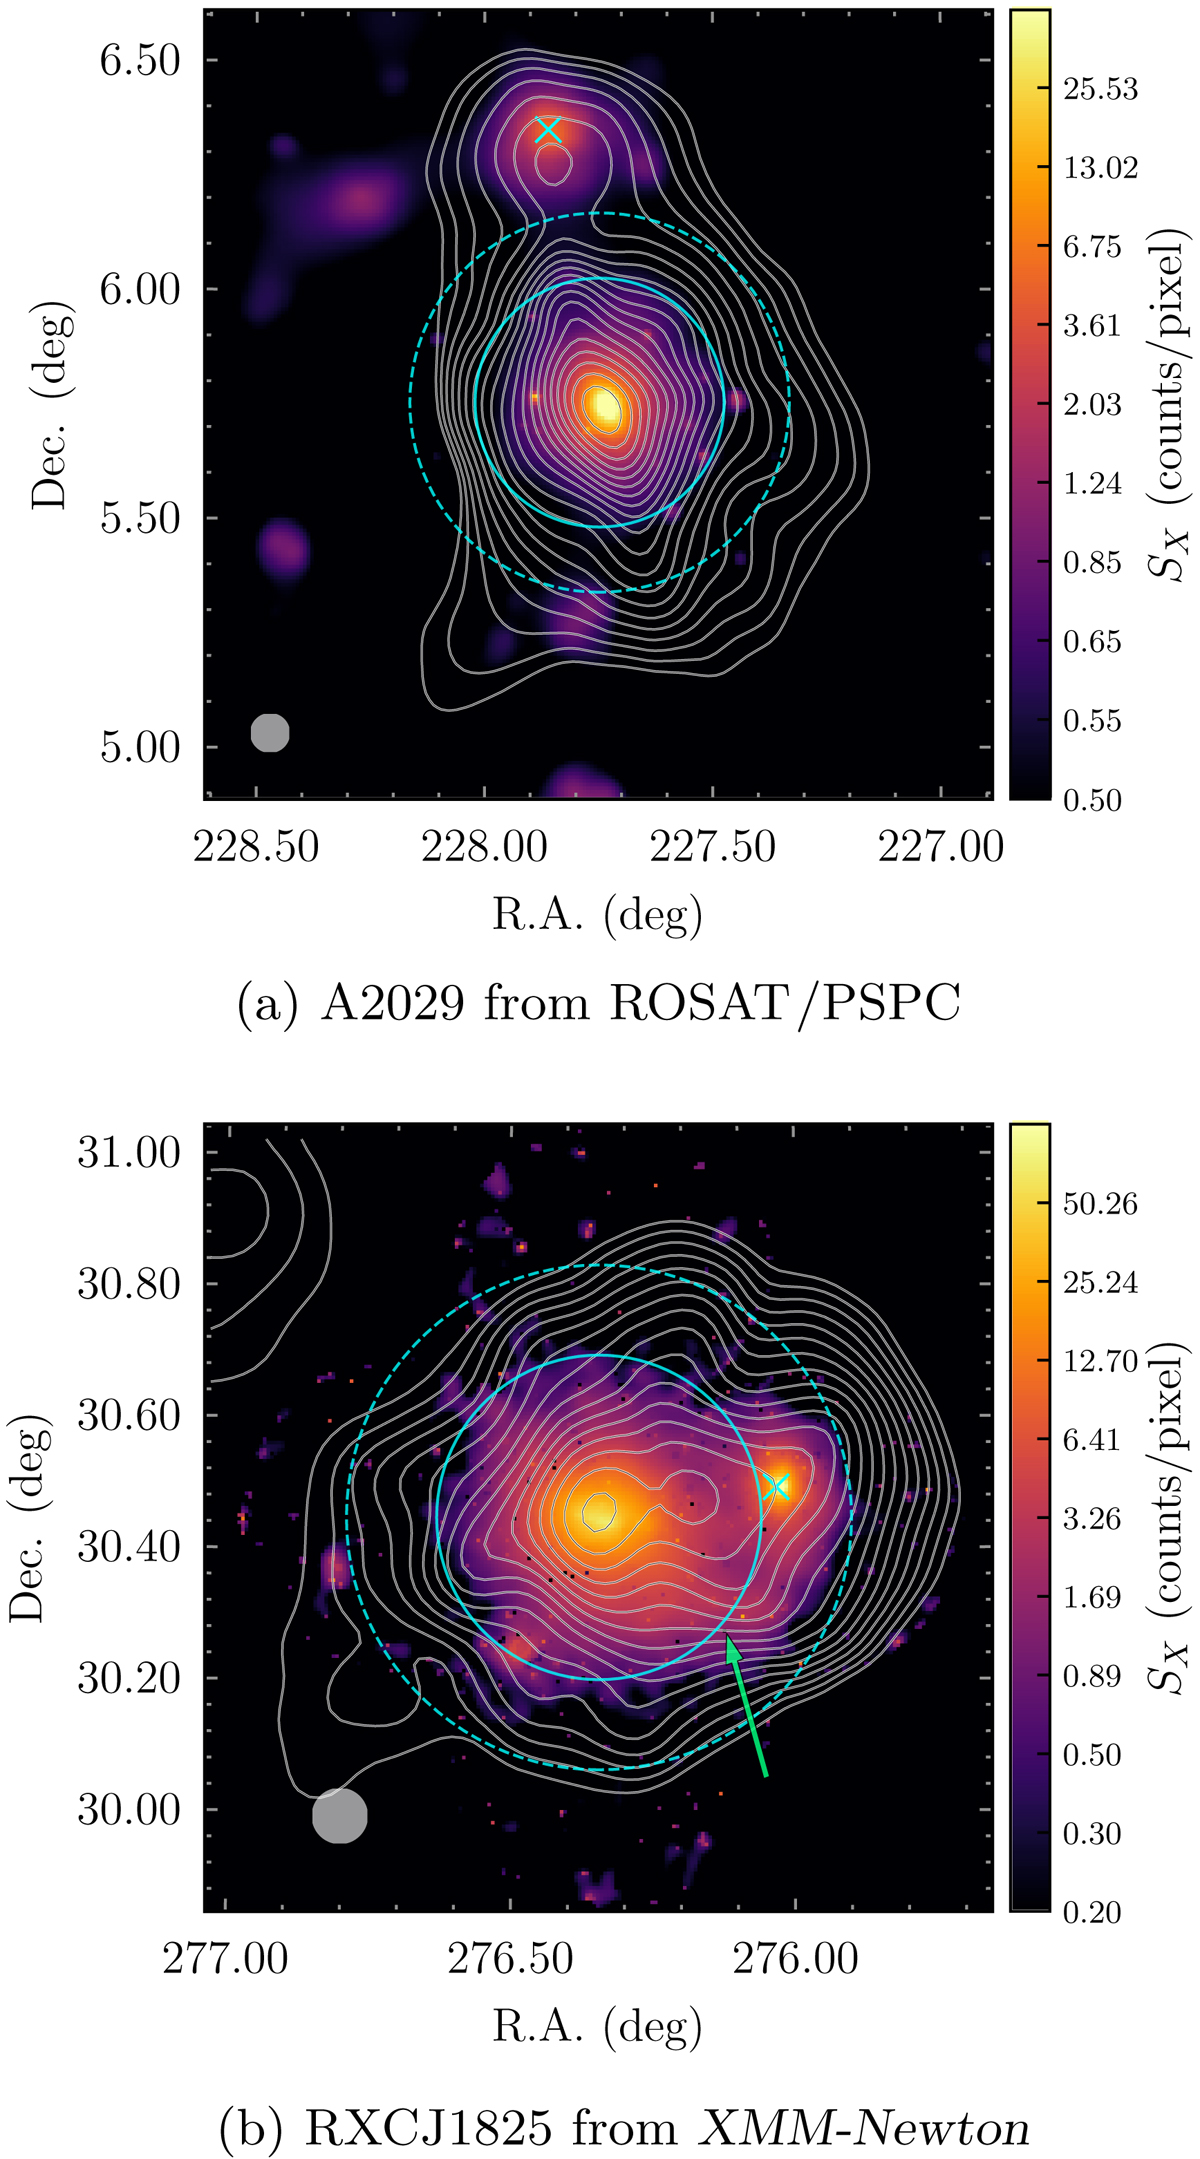
X-ray and tSZ signals of clusters A2029 and RXCJ2815. The maps show the vignetting-corrected and background-subtracted surface brightness in the X-ray energy band 0.5–2.5 keV. The superimposed contours represent the Compton y-parameter from our algorithm. The solid and dashed cyan circles on top of the images are drawn at R500 and R200, respectively. The shaded circles in the bottom left corner of the maps represent a 5 arcmin beam. a: cluster A2029 mapped by ROSAT/PSPC. The cyan cross indicates the position of the neighbour cluster A2033. b: cluster RXC J1825 mapped by XMM-Newton. The cyan cross marks the position of cluster CIZA J1824, while the green arrow identifies a significant elongation which may be associated to stripped gas from a nearby group of galaxies.
Current usage metrics show cumulative count of Article Views (full-text article views including HTML views, PDF and ePub downloads, according to the available data) and Abstracts Views on Vision4Press platform.
Data correspond to usage on the plateform after 2015. The current usage metrics is available 48-96 hours after online publication and is updated daily on week days.
Initial download of the metrics may take a while.