Free Access
Fig. 3.
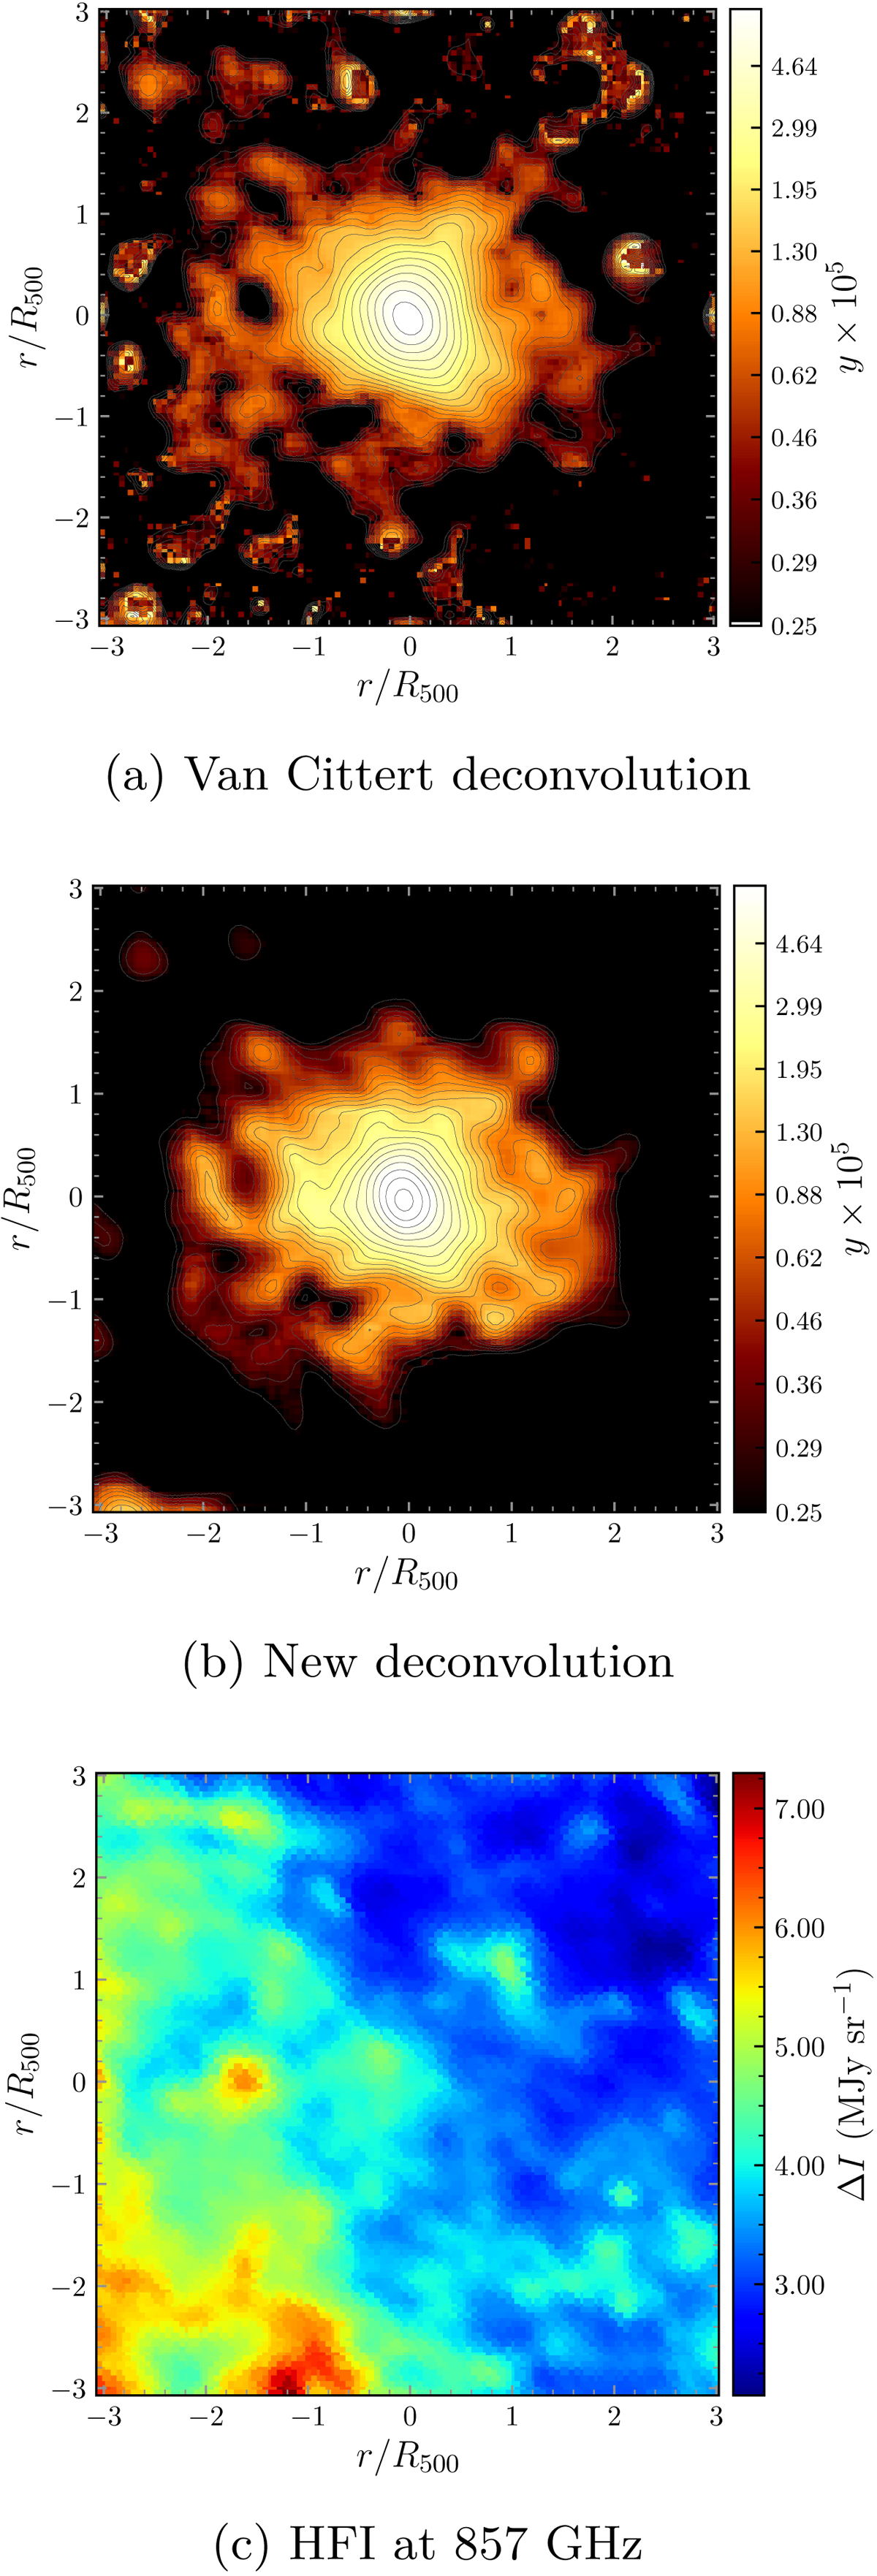
Region centred on cluster A2319. a: Compton y-parameter reconstructed with Van Cittert deconvolution. b: Compton y-parameter reconstructed with the wavelet coefficient-wise deconvolution. The colour scale is logarithmic and contours are logarithmically spaced by a factor of ![]() . c: raw HFI map at 857 GHz.
. c: raw HFI map at 857 GHz.
Current usage metrics show cumulative count of Article Views (full-text article views including HTML views, PDF and ePub downloads, according to the available data) and Abstracts Views on Vision4Press platform.
Data correspond to usage on the plateform after 2015. The current usage metrics is available 48-96 hours after online publication and is updated daily on week days.
Initial download of the metrics may take a while.