Fig. 2.
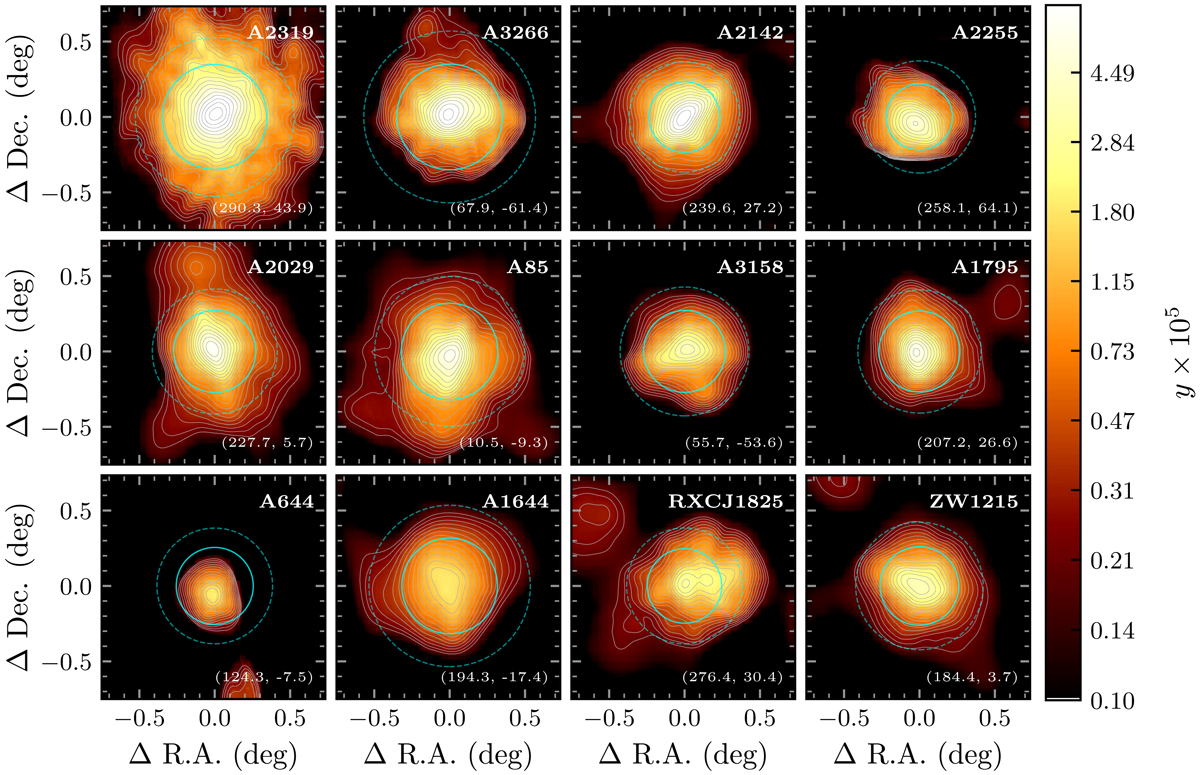
Compton y-parameter of X-COP clusters from our spectral imaging. The solid and dashed cyan circles on top of the images mark the R500 and R200 radii, respectively. The colour scale is logarithmic and contours are logarithmically spaced by a factor of ![]() , starting from 2 × 10⁻⁶. The J2000 Equatorial coordinates of the cluster centres are reported in the bottom right corner of each map.
, starting from 2 × 10⁻⁶. The J2000 Equatorial coordinates of the cluster centres are reported in the bottom right corner of each map.
Current usage metrics show cumulative count of Article Views (full-text article views including HTML views, PDF and ePub downloads, according to the available data) and Abstracts Views on Vision4Press platform.
Data correspond to usage on the plateform after 2015. The current usage metrics is available 48-96 hours after online publication and is updated daily on week days.
Initial download of the metrics may take a while.