Fig. 7
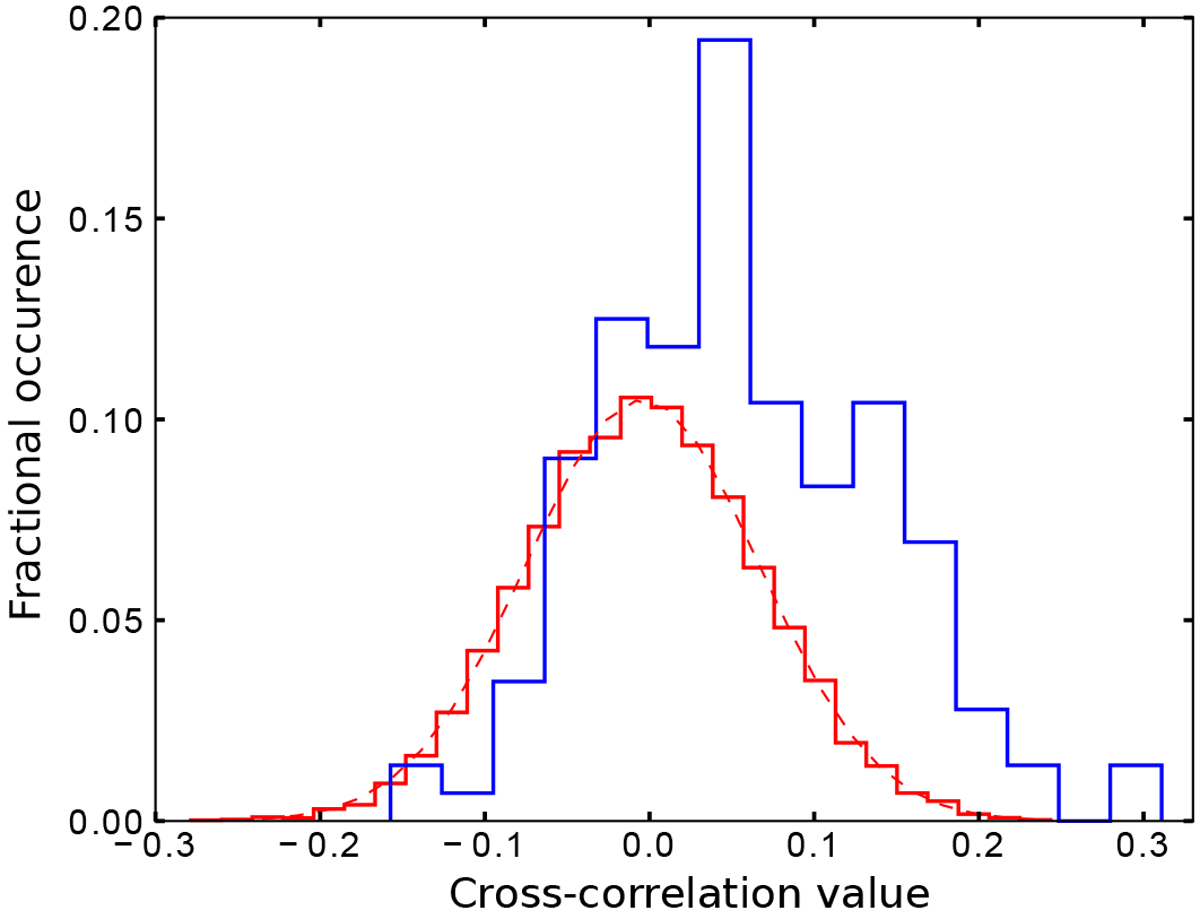
Distribution of cross-correlation values around the expected planetary radial velocities (in-trail, blue), far away from the planet’s velocities (out-of-trail, red), and a Gaussian distribution with the same mean and variance as the out-of-trail distribution (dashed red). As expected for a signal of planetary origin, the in- and out-of-trail distributions show significantly different means.
Current usage metrics show cumulative count of Article Views (full-text article views including HTML views, PDF and ePub downloads, according to the available data) and Abstracts Views on Vision4Press platform.
Data correspond to usage on the plateform after 2015. The current usage metrics is available 48-96 hours after online publication and is updated daily on week days.
Initial download of the metrics may take a while.