Fig. 5
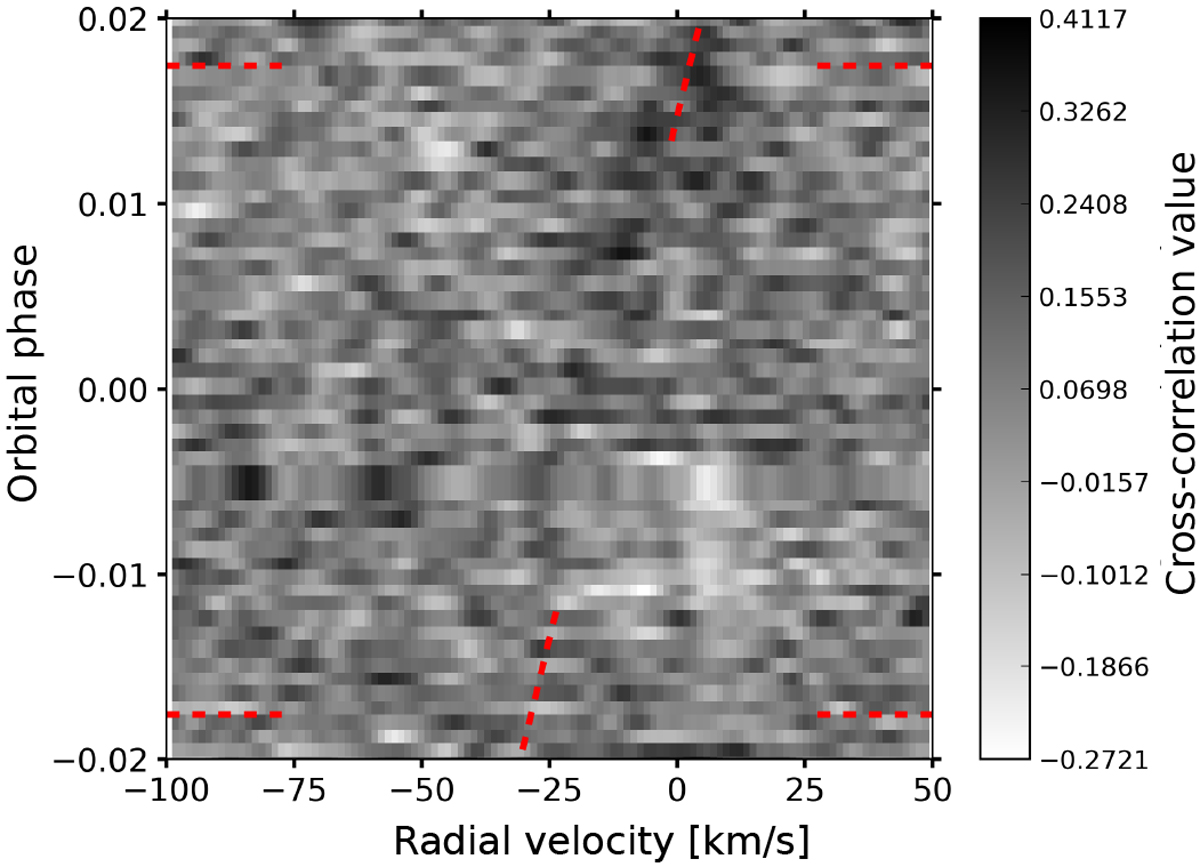
Cross-correlation values as a function of the orbital phase and planet orbital velocity in the Earth’s rest-frame. The results were obtained from 18 useful NIR orders. The orbital phase of the first and last in-transit spectra areindicated by horizontal dashed red lines. A visual guide to the expected exoplanet velocities (i.e., KP = 140 km s−1 and assuming no additional winds in the atmosphere of the planet) is indicated with tilted dashed red lines.
Current usage metrics show cumulative count of Article Views (full-text article views including HTML views, PDF and ePub downloads, according to the available data) and Abstracts Views on Vision4Press platform.
Data correspond to usage on the plateform after 2015. The current usage metrics is available 48-96 hours after online publication and is updated daily on week days.
Initial download of the metrics may take a while.