Fig. 4
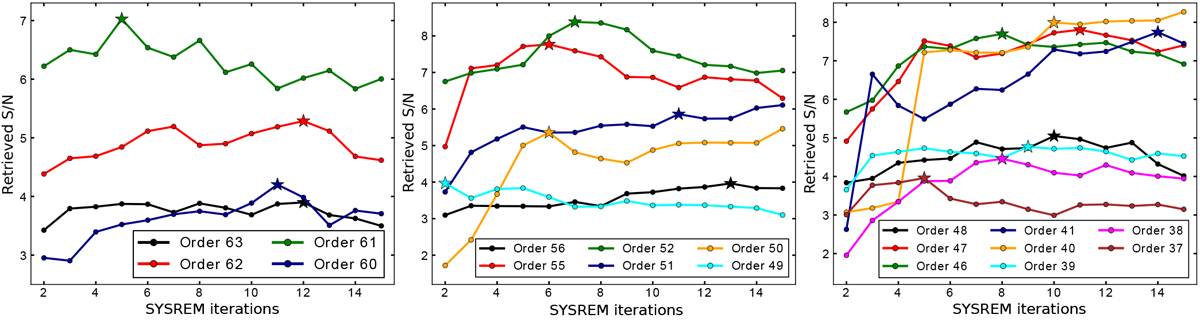
Evolution of the retrieved S/N of the injected signal with the number of SYSREM iterations for the 1.0 μm band (left), 1.15 μm band (middle), and 1.4 μm band (right). The model is injected at 5× the nominal strength. For the spectral orders where a very small signal is retrieved (i.e., S∕N < 3), we injected astronger model at 10× (for orders 49 and 38) and at 12× (for order 60) the nominal strength so as to ensure the injected signal is clearly measured (i.e., S∕N ≥ 3). The stars represent the selected number of iterations for each spectral order at the peak of the recovered S/N (see text).
Current usage metrics show cumulative count of Article Views (full-text article views including HTML views, PDF and ePub downloads, according to the available data) and Abstracts Views on Vision4Press platform.
Data correspond to usage on the plateform after 2015. The current usage metrics is available 48-96 hours after online publication and is updated daily on week days.
Initial download of the metrics may take a while.