Fig. 3
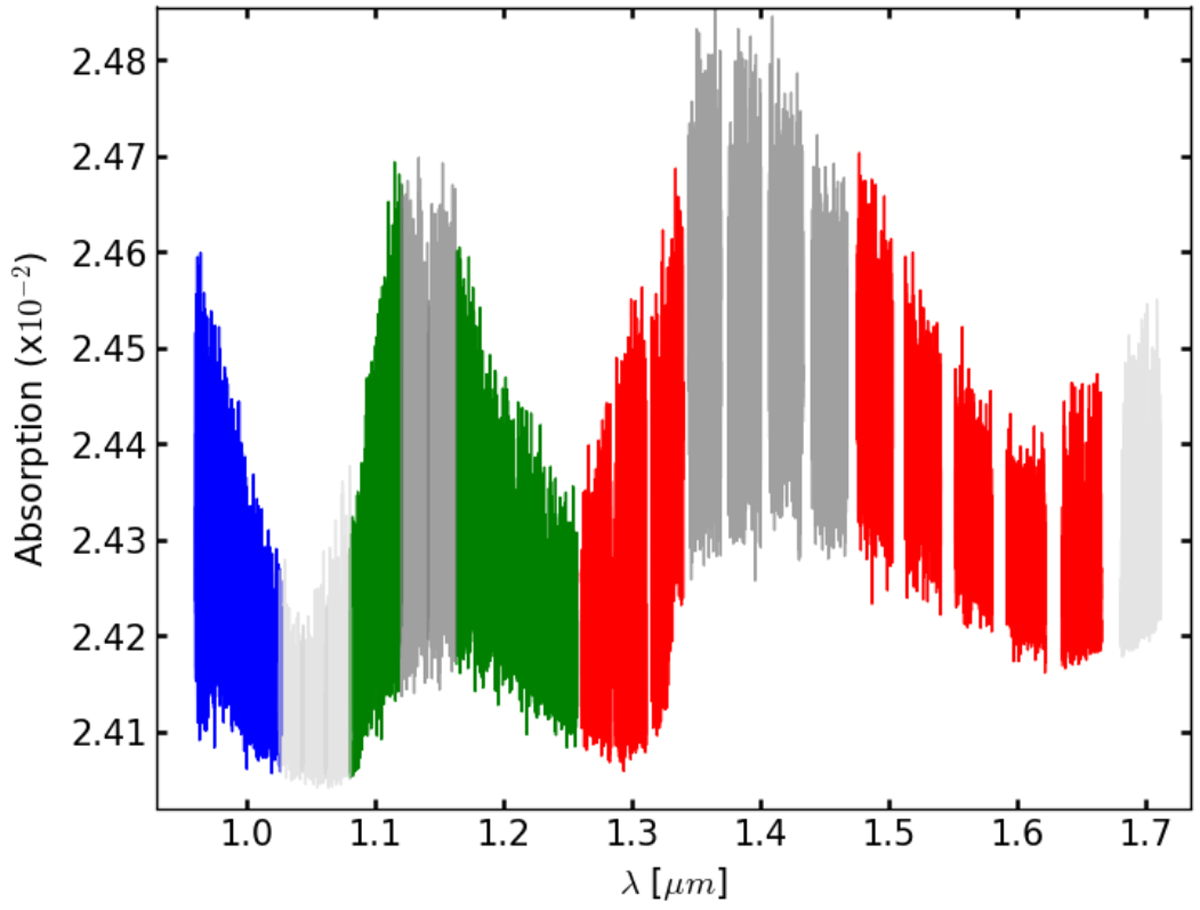
Watervapor model transmission spectra computed for the best-fitting p-T profile in Brogi et al. (2017) and an H2O volume mixing ratio of 10−5. The model is shown at the same wavelengths of the data. The CARMENES line spread function for the NIR channel has been applied. The 1.0, 1.15 and 1.4 μm bands are shown in blue, green, and red, respectively. The orders in dark gray represent the a priori masks. The orders in light graywere masked a posteriori.
Current usage metrics show cumulative count of Article Views (full-text article views including HTML views, PDF and ePub downloads, according to the available data) and Abstracts Views on Vision4Press platform.
Data correspond to usage on the plateform after 2015. The current usage metrics is available 48-96 hours after online publication and is updated daily on week days.
Initial download of the metrics may take a while.