This article has an erratum: [https://doi.org/10.1051/0004-6361/201936026e]
Fig. 4.
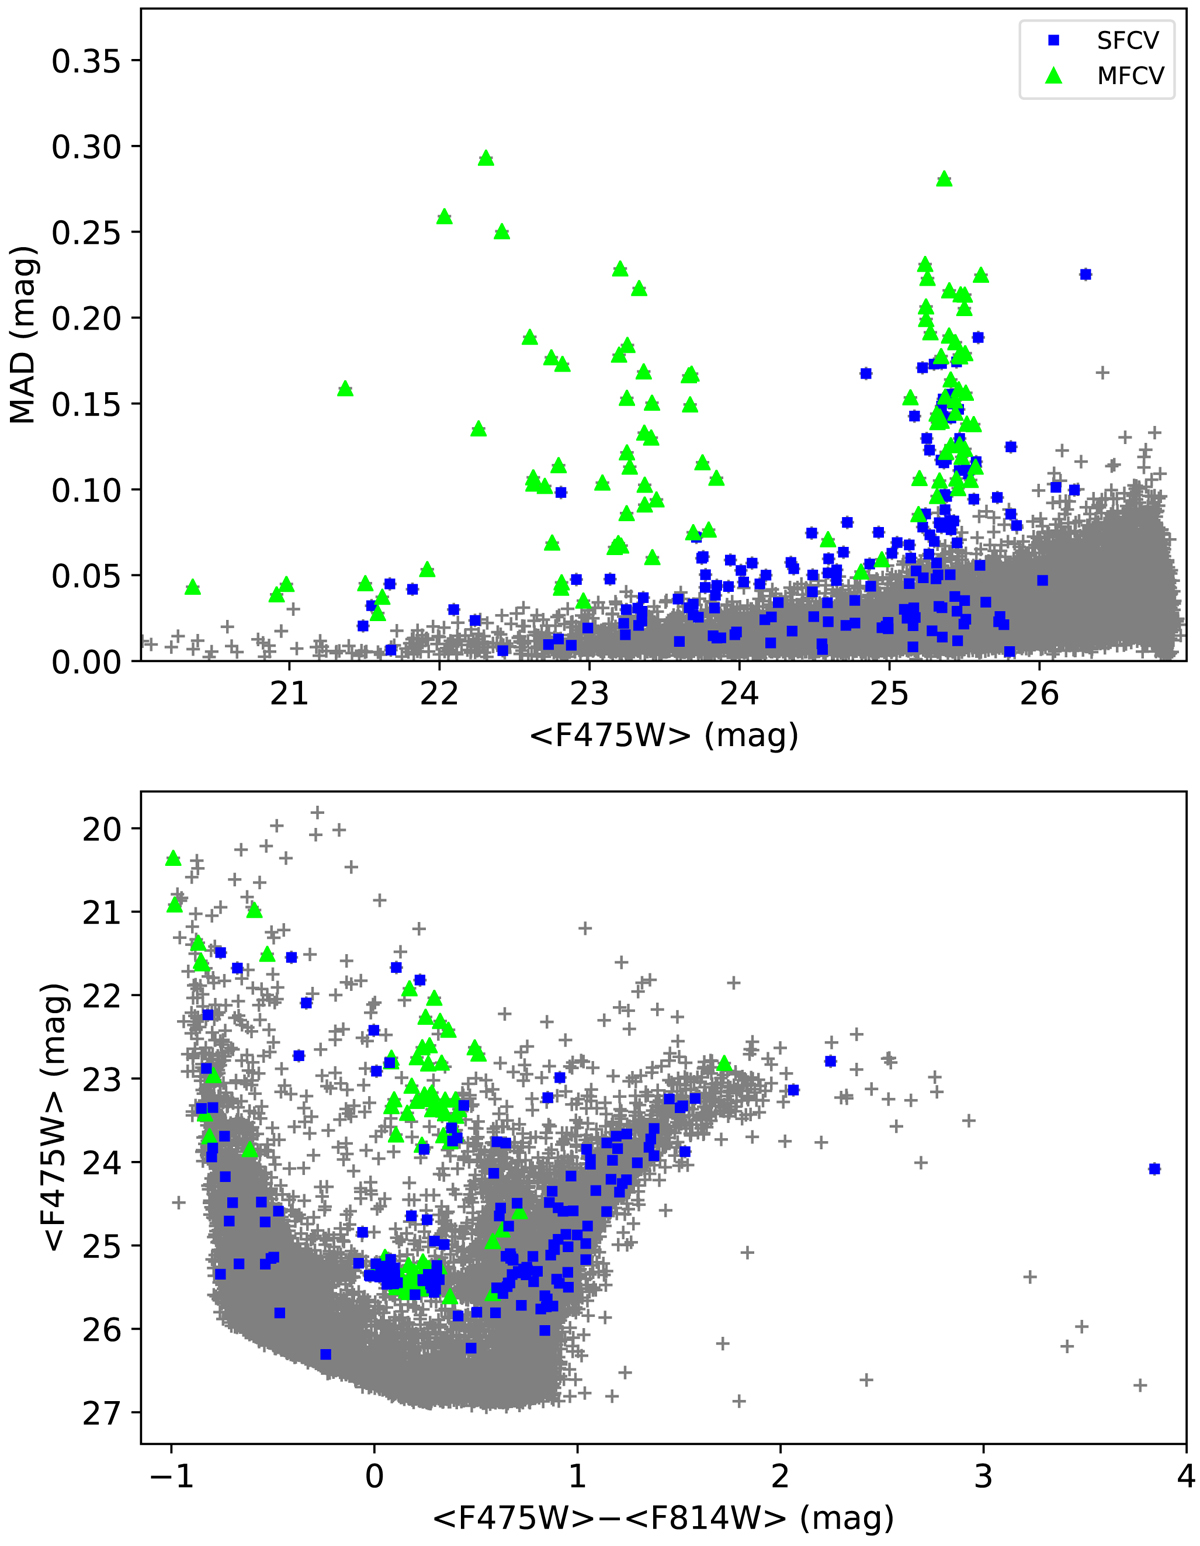
Upper panel: MAD vs. median ACS_F475W magnitudes for all sources in the Control Sample field IC 1613, shown with gray crosses. The multi-filter variable candidates (MFVCs) are marked with green triangles, while the single-filter candidates (SFVCs) are marked with blue squares. SFVCs that have low MAD values in the F475W filter were selected as having MAD values above the threshold in the F814W filter. Lower panel: color-magnitude diagram for IC 1613 showing the location of the MFVCs and SFVCs in the field. Many of the candidate variables lie on the instability strip.
Current usage metrics show cumulative count of Article Views (full-text article views including HTML views, PDF and ePub downloads, according to the available data) and Abstracts Views on Vision4Press platform.
Data correspond to usage on the plateform after 2015. The current usage metrics is available 48-96 hours after online publication and is updated daily on week days.
Initial download of the metrics may take a while.