Press Release
Free Access
This article has an erratum: [https://doi.org/10.1051/0004-6361/201936026e]
Fig. A.2.
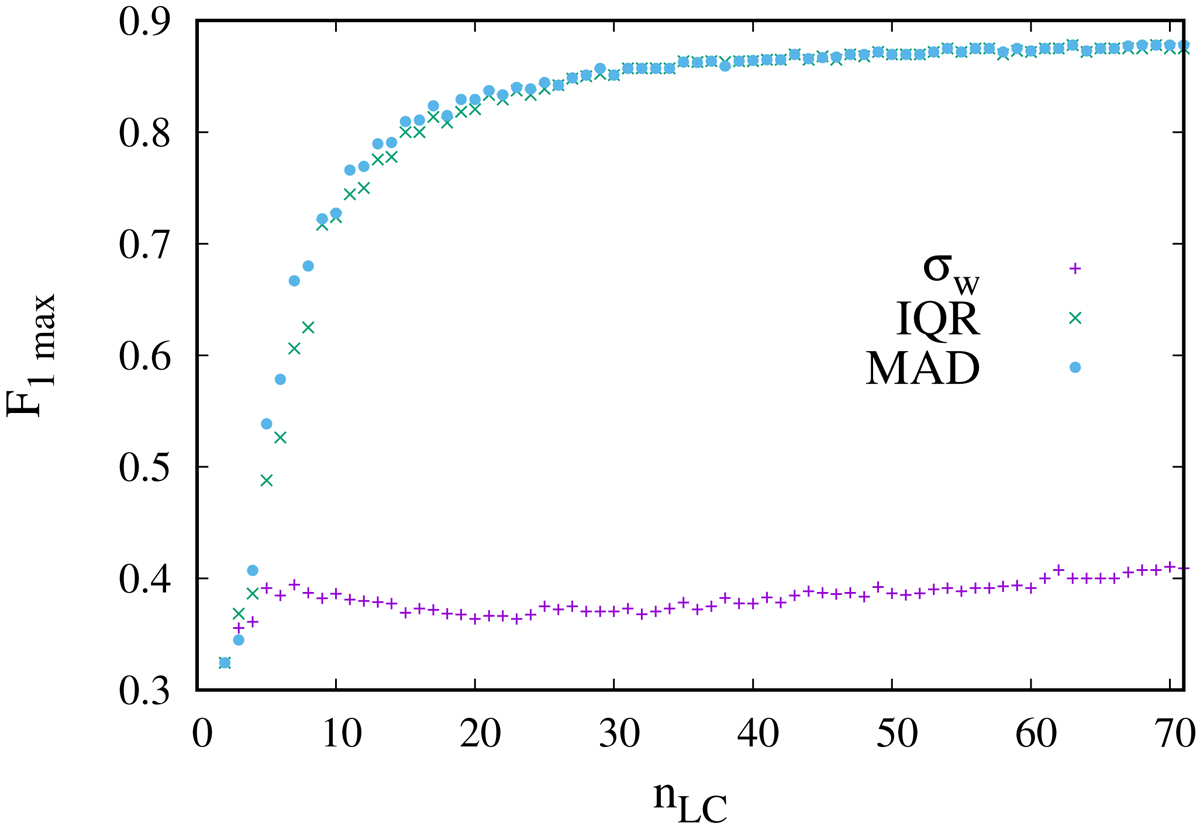
Variability detection efficiency (F1 max score) as a function of the number of points in the light curve. The simulated variability was injected into the WFC3_F775W filter observations of M4. The data set is heavily affected by cosmic rays, resulting in the poor performance of σw compared to the robust indices MAD and IQR.
Current usage metrics show cumulative count of Article Views (full-text article views including HTML views, PDF and ePub downloads, according to the available data) and Abstracts Views on Vision4Press platform.
Data correspond to usage on the plateform after 2015. The current usage metrics is available 48-96 hours after online publication and is updated daily on week days.
Initial download of the metrics may take a while.