Fig. 9.
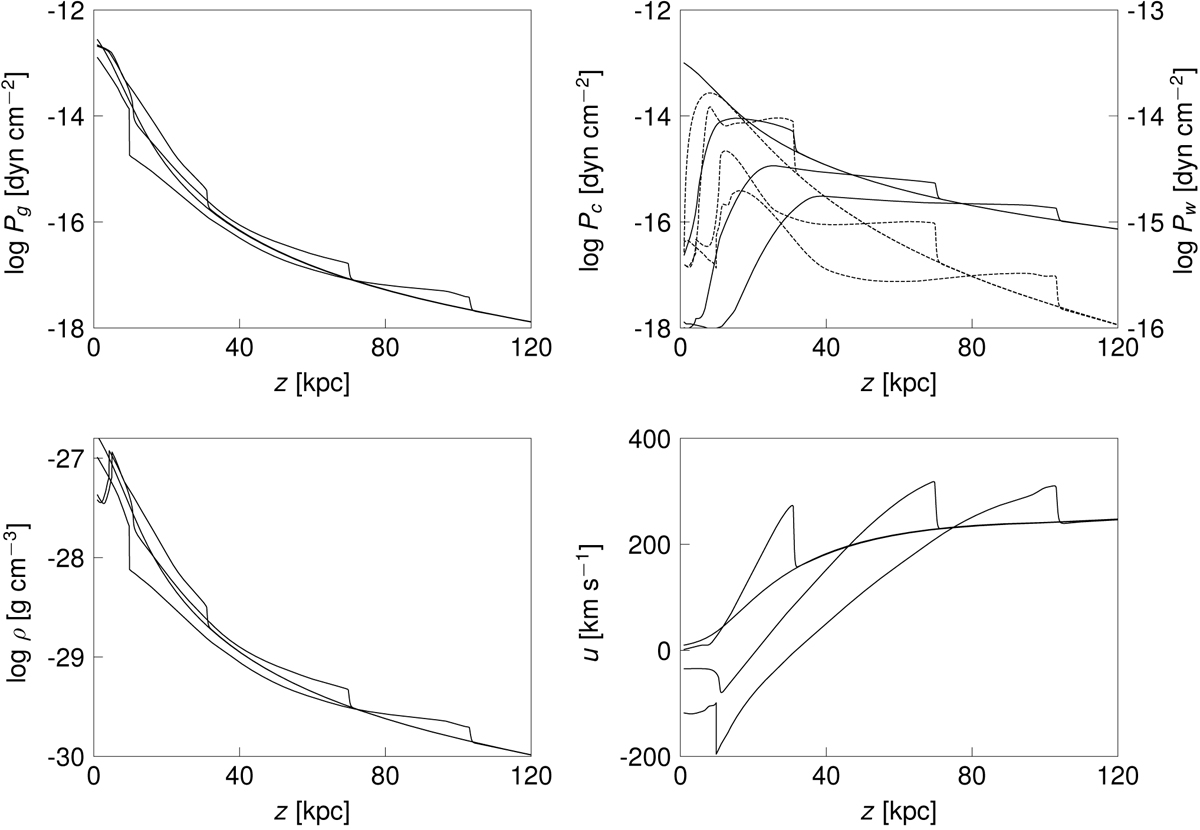
Radial structures for Model W up to 120 kpc at three times, 7 × 10⁷, 1.4 × 10⁸, and 2.1 × 10⁸ years, exhibit the shock waves propagating along the flux tube. The upper panels show the different pressure contributions from thermal gas Pg, CRs Pc, and waves Pw (dashed lines). The density and velocity are characterized by the large scale outflow with decreasing inner values. The last model at 2.1 × 10⁸ years presents the reverse shock located around 11 kpc and the inner parts of the flow are directed inwards.
Current usage metrics show cumulative count of Article Views (full-text article views including HTML views, PDF and ePub downloads, according to the available data) and Abstracts Views on Vision4Press platform.
Data correspond to usage on the plateform after 2015. The current usage metrics is available 48-96 hours after online publication and is updated daily on week days.
Initial download of the metrics may take a while.