Fig. 6.
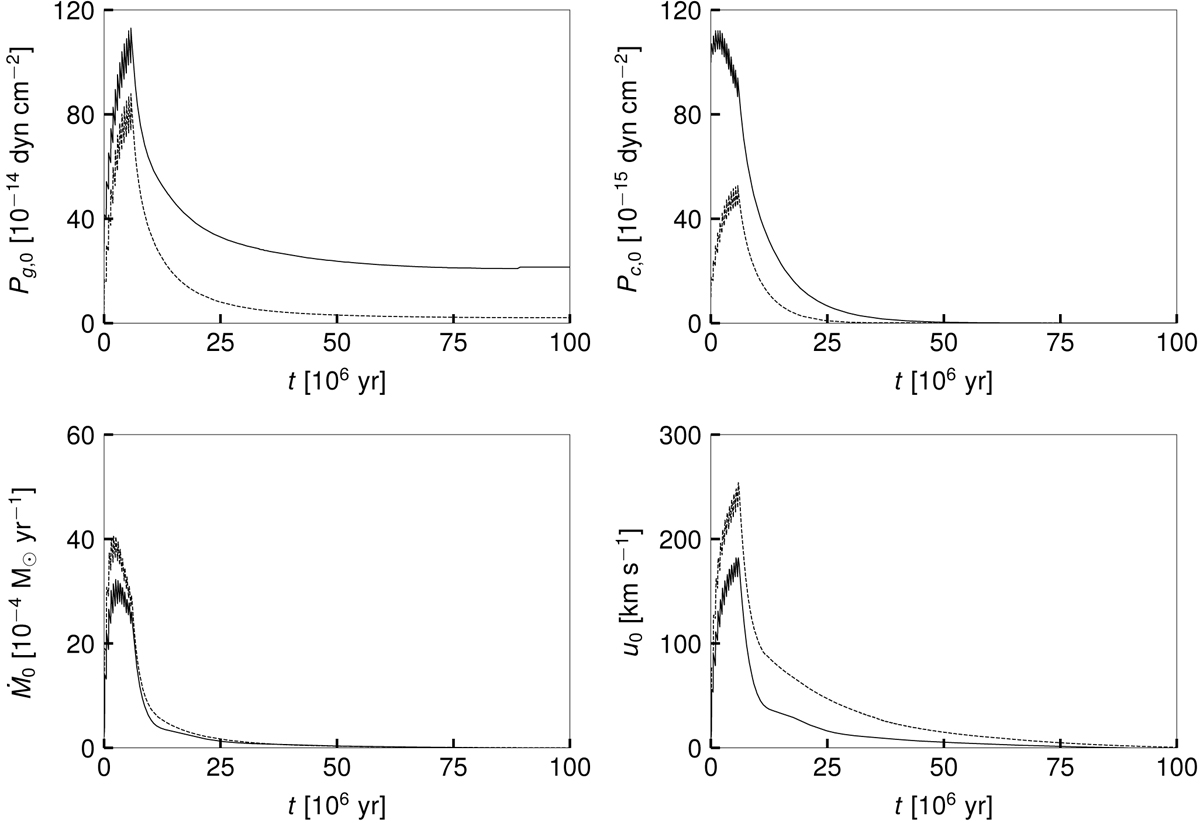
Gas pressure Pg, 0 (upper panel, left) at the inner boundary (z0 = 1 kpc) for Model W (full line) and Model H (dashed line) as seen over a time interval of 108 years for the case when mass and energy losses are included. The CR pressure Pc, 0 (upper panel, right) is about a factor of 10 less than the gas pressure (note the change of scale). The decrease of the mass loss rate Ṁ0 (lower panel, left) occurs already 10 × 106 yr after the SNe have triggered an outflow. After this time the galactic wind changes its nature as inferred from the decreasing values of the outflow velocity u0 (lower panel, right).
Current usage metrics show cumulative count of Article Views (full-text article views including HTML views, PDF and ePub downloads, according to the available data) and Abstracts Views on Vision4Press platform.
Data correspond to usage on the plateform after 2015. The current usage metrics is available 48-96 hours after online publication and is updated daily on week days.
Initial download of the metrics may take a while.