Fig. 5.
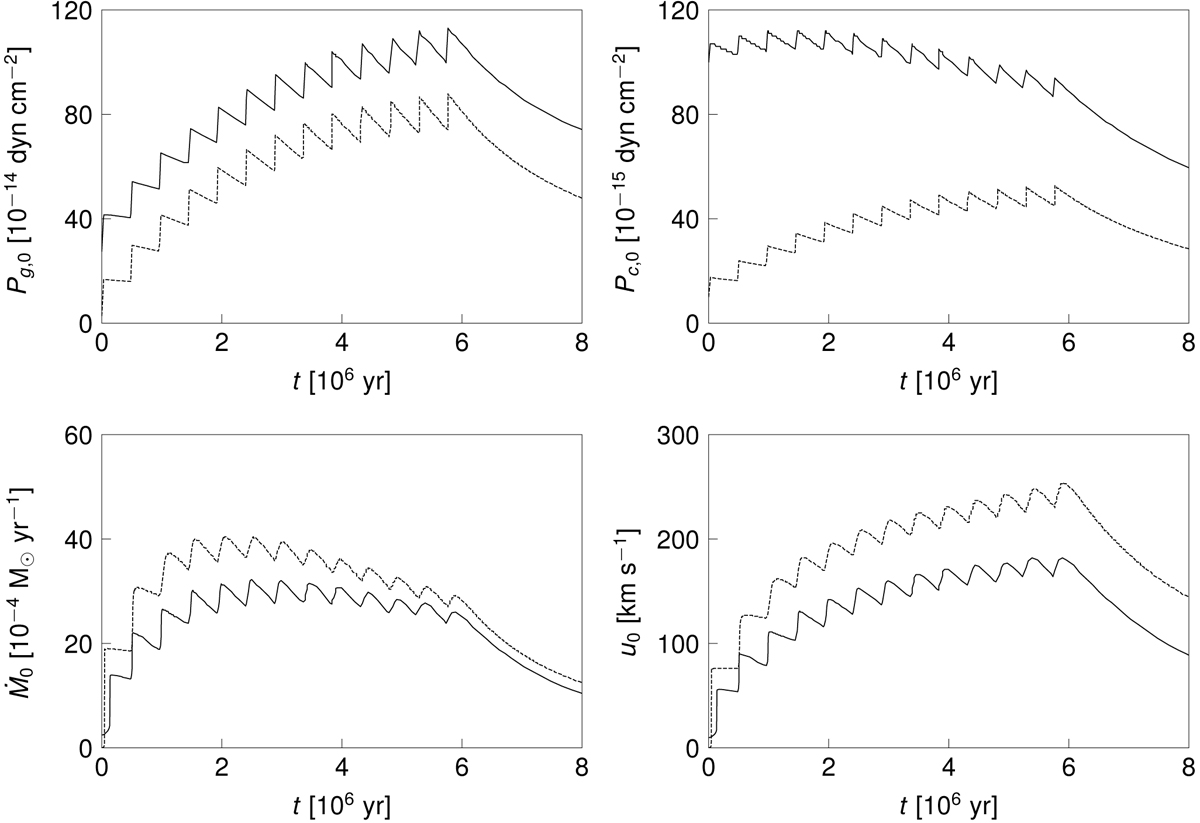
Gas pressure Pg, 0 (upper left panel) at the inner boundary (z0 = 1 kpc) of the flux tube for Model W (full line) and Model H (dashed line) as a function of time including the feedback by galactic wind loss. The CR pressure Pc, 0 (upper panel right) is lower by about a factor of 10 compared to the gas pressure. All boundary values decrease between the SN explosions. After 6 × 10⁶ yr, when the last SN exploded, the boundary values get monotonically smaller, caused by the outflow from the SB. Lower panel (left): exhibits the mass loss by the galactic wind, which reaches a maximum rate around 3.2 × 10⁻³ M⊙ yr−1 for Model W and 4.1 × 10⁻³ M⊙ yr−1 for Model H. In both models the maximum outflow velocity u0 (lower panel right) is reached at the last SN explosion.
Current usage metrics show cumulative count of Article Views (full-text article views including HTML views, PDF and ePub downloads, according to the available data) and Abstracts Views on Vision4Press platform.
Data correspond to usage on the plateform after 2015. The current usage metrics is available 48-96 hours after online publication and is updated daily on week days.
Initial download of the metrics may take a while.