Fig. 4.
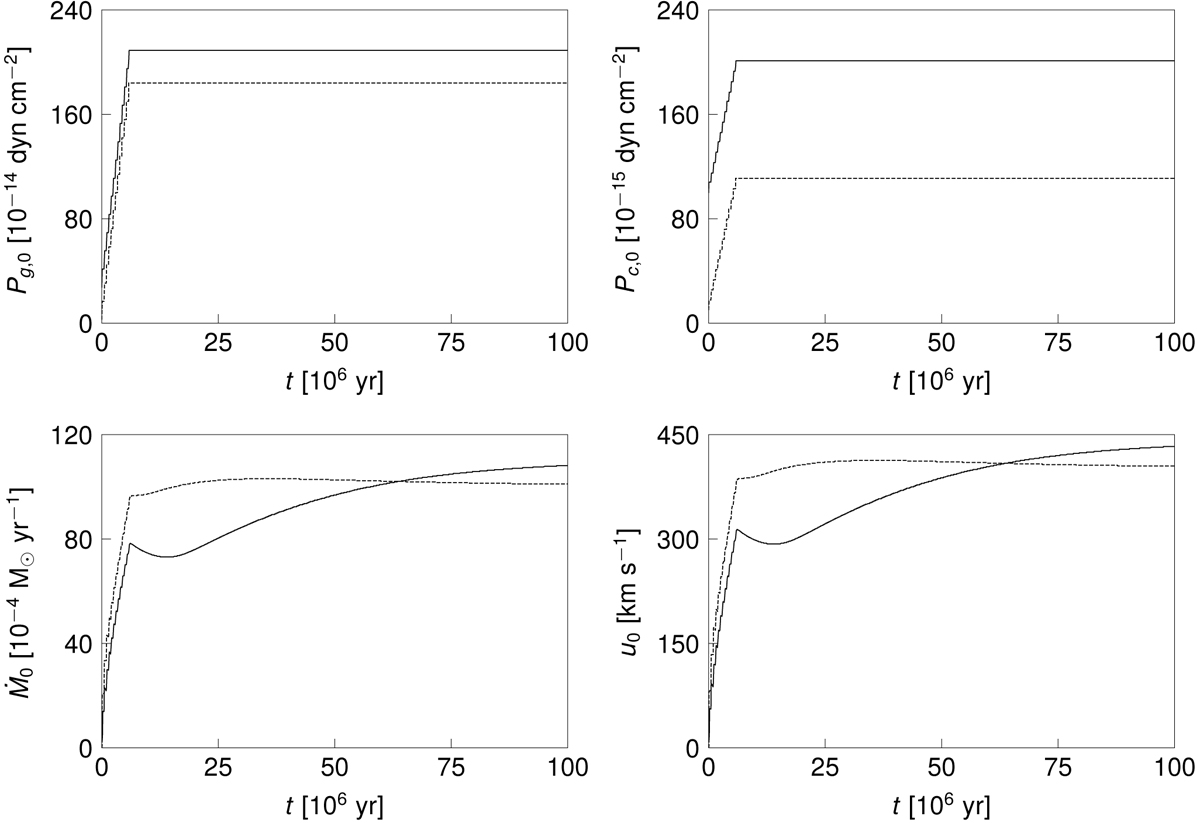
Gas pressure Pg, 0 at the inner boundary (z0 = 1 kpc) of the flux tube for Model W (full line) and Model H (dashed line) as a function of time over 108 years. After 6 × 10⁶ yr the last SN exploded and we keep the values of the boundary values fixed, except the velocity u0. Lower panel (right): illustrates how the velocity reacts to the change of the inner boundary from increasing pressures to constant pressures after 6 × 10⁶ years. The lower panels exhibit the mass loss by the galactic wind, that is, Ṁ0 = A0ρ0u0 and the velocity at u0. We note that Model H (dotted line) generates initially higher mass loss rates because the wind expands into a more tenuous medium than Model W (see text for more details).
Current usage metrics show cumulative count of Article Views (full-text article views including HTML views, PDF and ePub downloads, according to the available data) and Abstracts Views on Vision4Press platform.
Data correspond to usage on the plateform after 2015. The current usage metrics is available 48-96 hours after online publication and is updated daily on week days.
Initial download of the metrics may take a while.