Fig. 11.
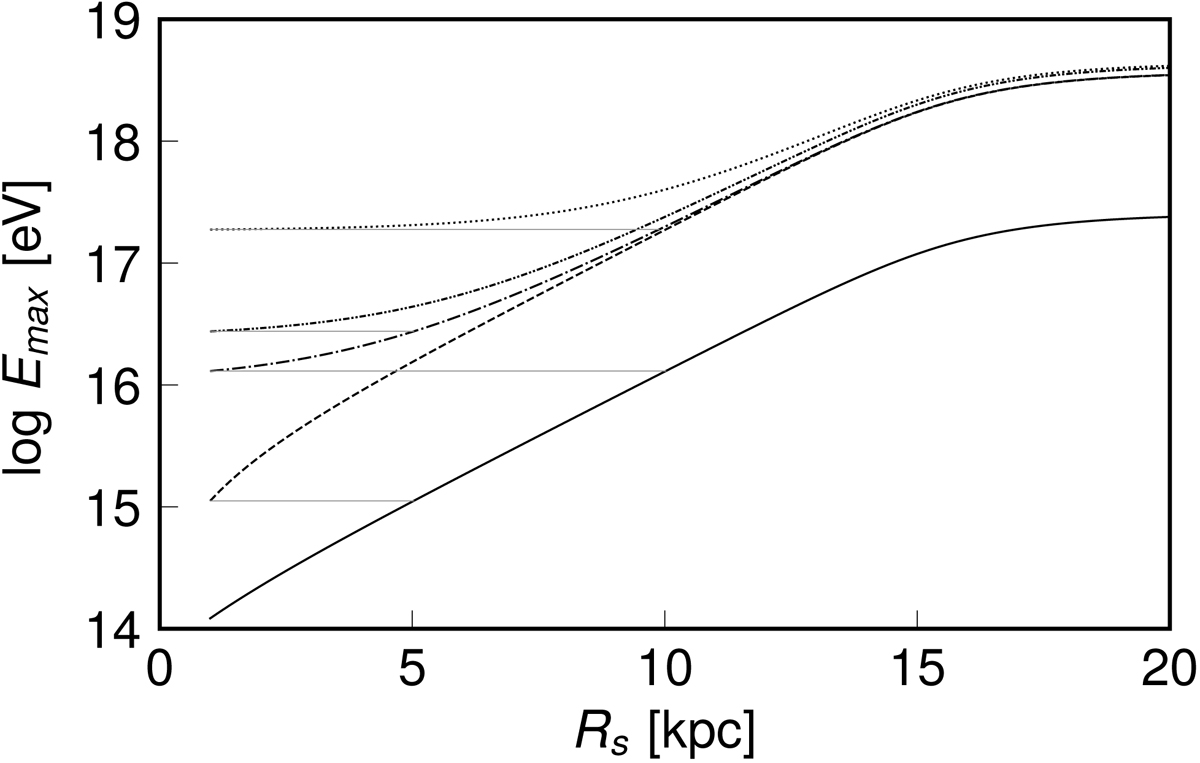
Evolution of the maximum (full line) particle energy Emax in units of [eV] as a function of the shock distance from the galactic plane in units of [kpc] for Model H. The full line corresponds to the first shock (see also Fig. 8), the dashed lines plot particles re-accelerated by the second shock waves, and the dashed-dotted lines exhibit the energy gains due to the third shock wave.
Current usage metrics show cumulative count of Article Views (full-text article views including HTML views, PDF and ePub downloads, according to the available data) and Abstracts Views on Vision4Press platform.
Data correspond to usage on the plateform after 2015. The current usage metrics is available 48-96 hours after online publication and is updated daily on week days.
Initial download of the metrics may take a while.