Fig. 9.
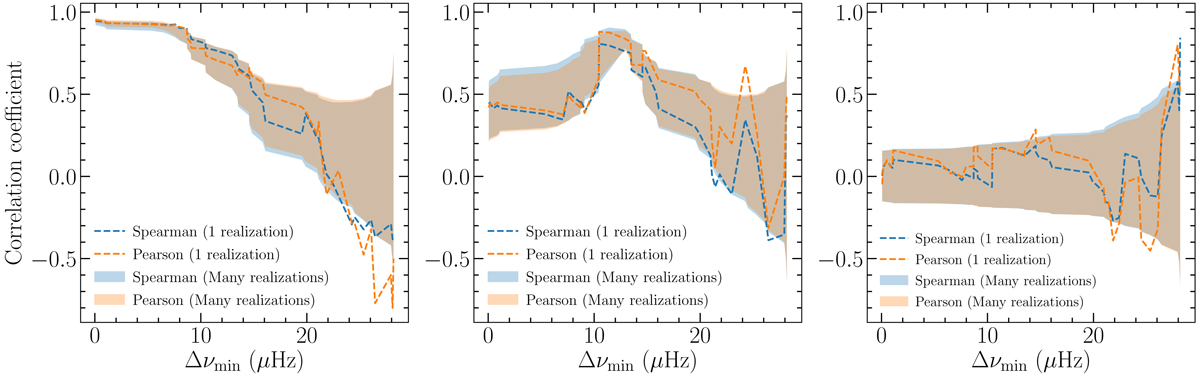
Correlation coefficients rp (orange) and rs (blue) vs. Δνmin for simulated glitches under hypothesis II, and for three Δν⋆ cases: left: when all glitches are correlated (Δν⋆ ∼ 0); middle: about half of them are correlated (Δν⋆ = 12.39 μHz); right: none of them is correlated (Δν⋆ = 40 μHz). Shaded regions represent the values of the 70% closer to the median of all realizations. The dashed lines show particular realizations. These simulations used the glitch sizes of PSR J0537−6910 and ![]() . In all cases the last points in the plots were calculated using the five largest glitches.
. In all cases the last points in the plots were calculated using the five largest glitches.
Current usage metrics show cumulative count of Article Views (full-text article views including HTML views, PDF and ePub downloads, according to the available data) and Abstracts Views on Vision4Press platform.
Data correspond to usage on the plateform after 2015. The current usage metrics is available 48-96 hours after online publication and is updated daily on week days.
Initial download of the metrics may take a while.