Free Access
Fig. 8.
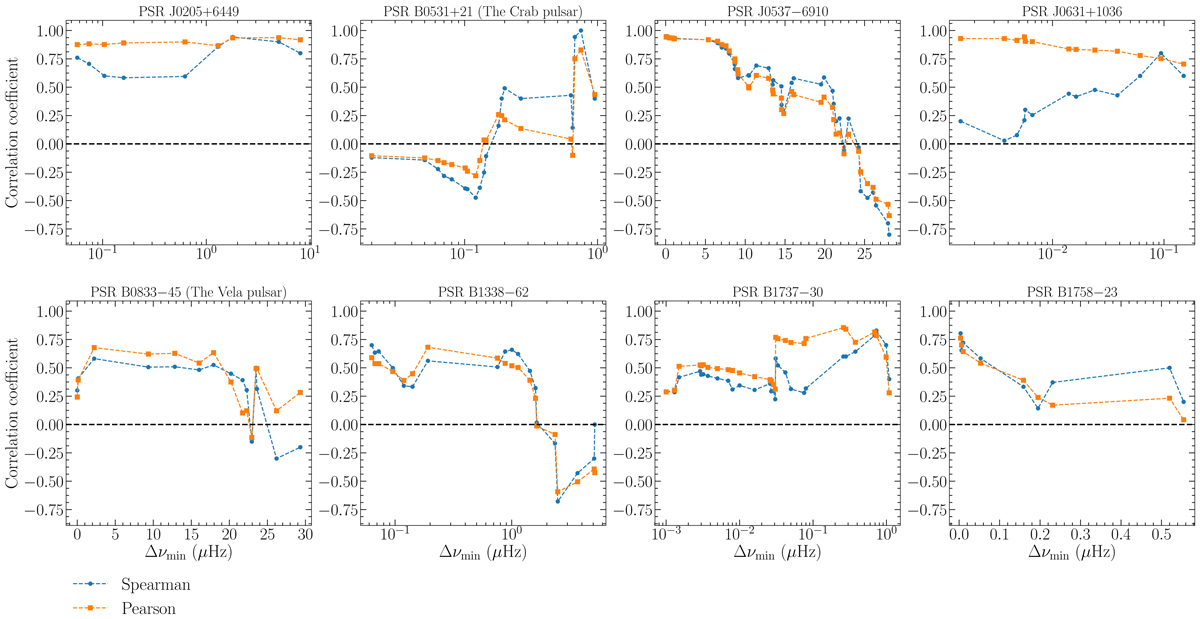
Pearson (orange squares) and Spearman (blue dots) correlation coefficients for glitches larger or equal than Δνmin. Each panel represents a pulsar in our sample. For each pulsar, the last point in the plot was calculated with its five largest glitches. Some pulsars are shown in log-scale for a better visualization.
Current usage metrics show cumulative count of Article Views (full-text article views including HTML views, PDF and ePub downloads, according to the available data) and Abstracts Views on Vision4Press platform.
Data correspond to usage on the plateform after 2015. The current usage metrics is available 48-96 hours after online publication and is updated daily on week days.
Initial download of the metrics may take a while.