Fig. 7.
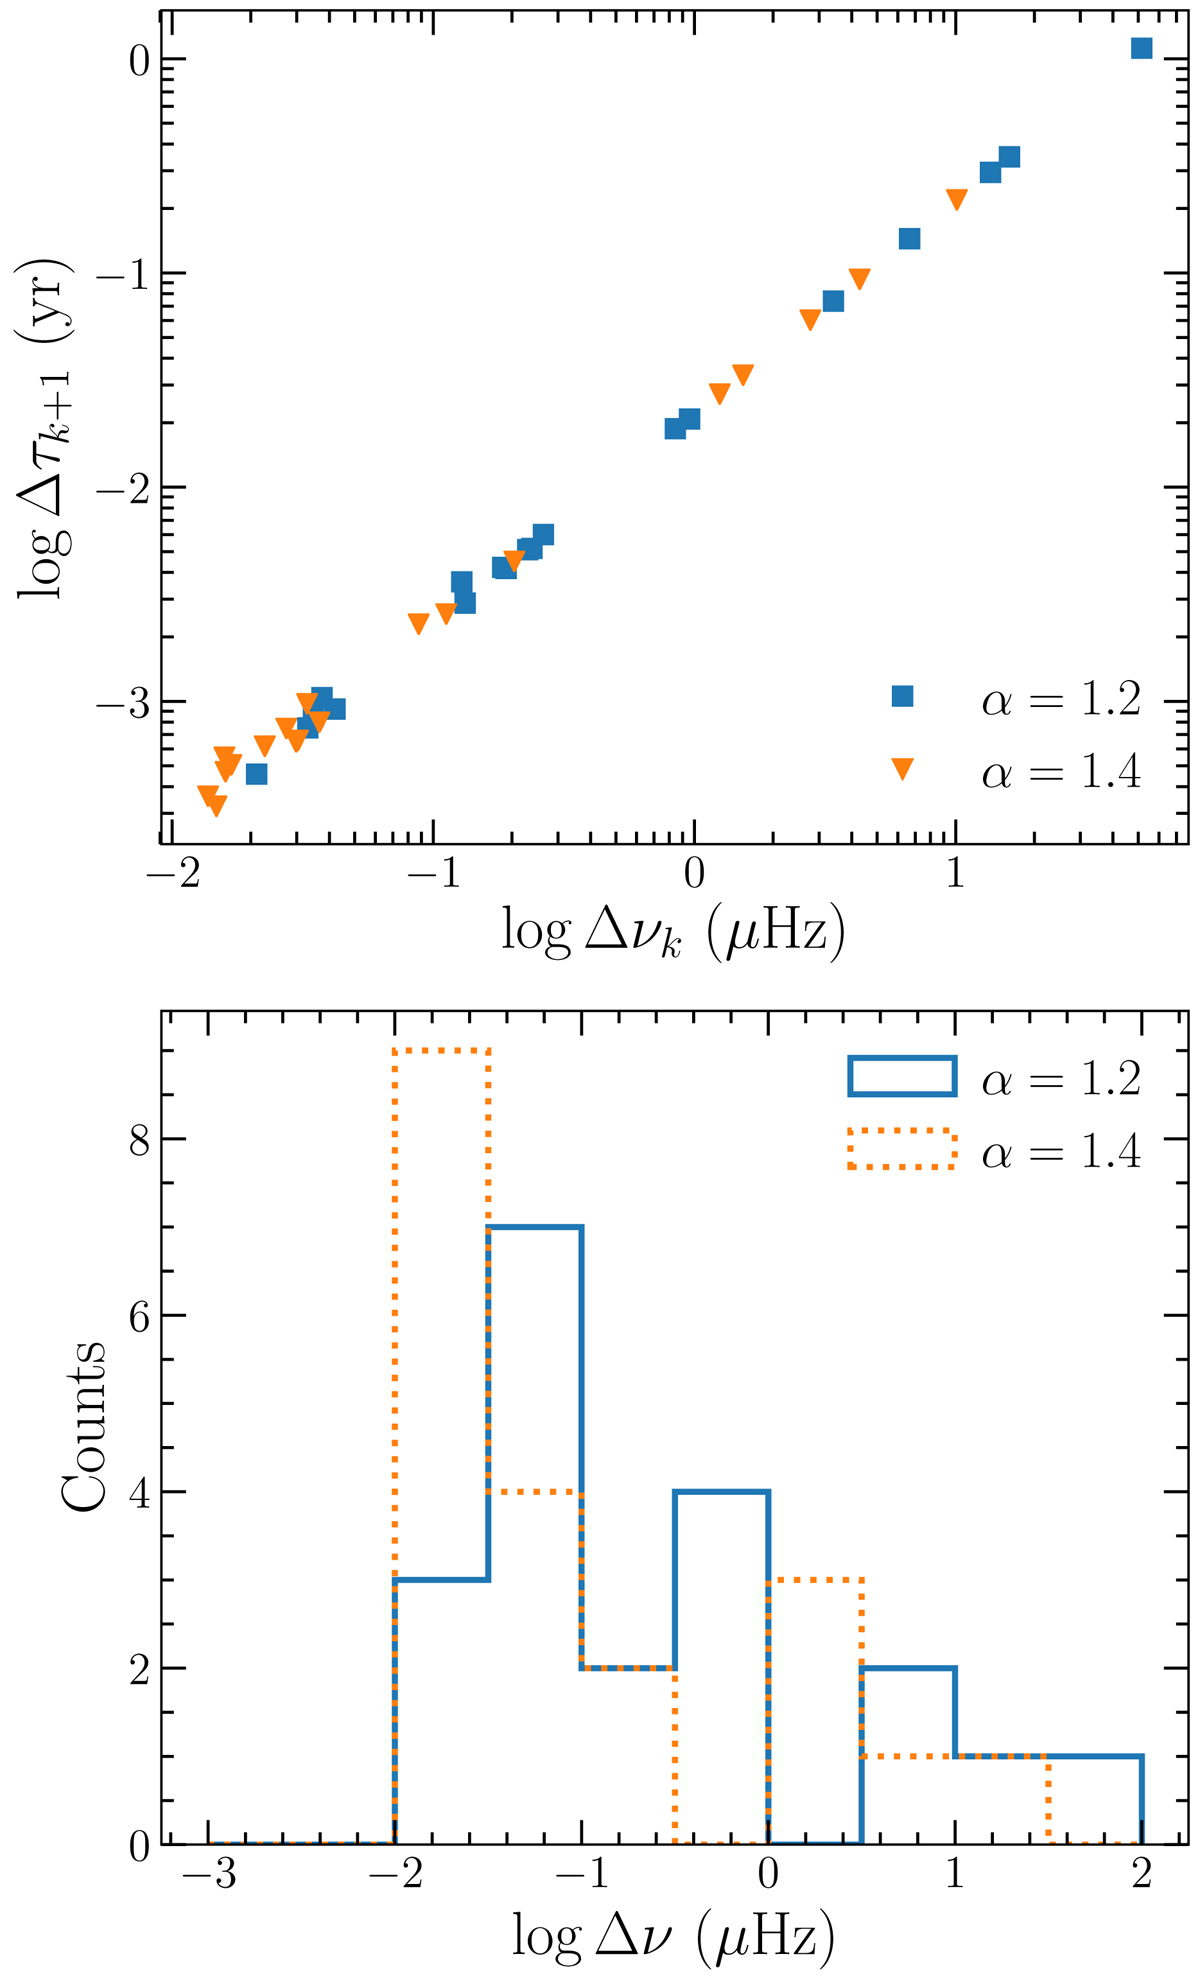
Reduced samples of simulated glitches from an assumed parent distribution dN/dΔν ∝ Δν−α with a perfect correlation Δτk + 1 = CΔνk, with C = 0.21 yr μHz−1. Top: resulting correlation between Δνk and Δτk + 1. Bottom: corresponding distributions of logΔν for the reduced samples of glitches. For both panels, each colour (and point marker) represents a typical realization in the simulations, for different power-law exponents as shown in the legends.
Current usage metrics show cumulative count of Article Views (full-text article views including HTML views, PDF and ePub downloads, according to the available data) and Abstracts Views on Vision4Press platform.
Data correspond to usage on the plateform after 2015. The current usage metrics is available 48-96 hours after online publication and is updated daily on week days.
Initial download of the metrics may take a while.