Fig. 2.
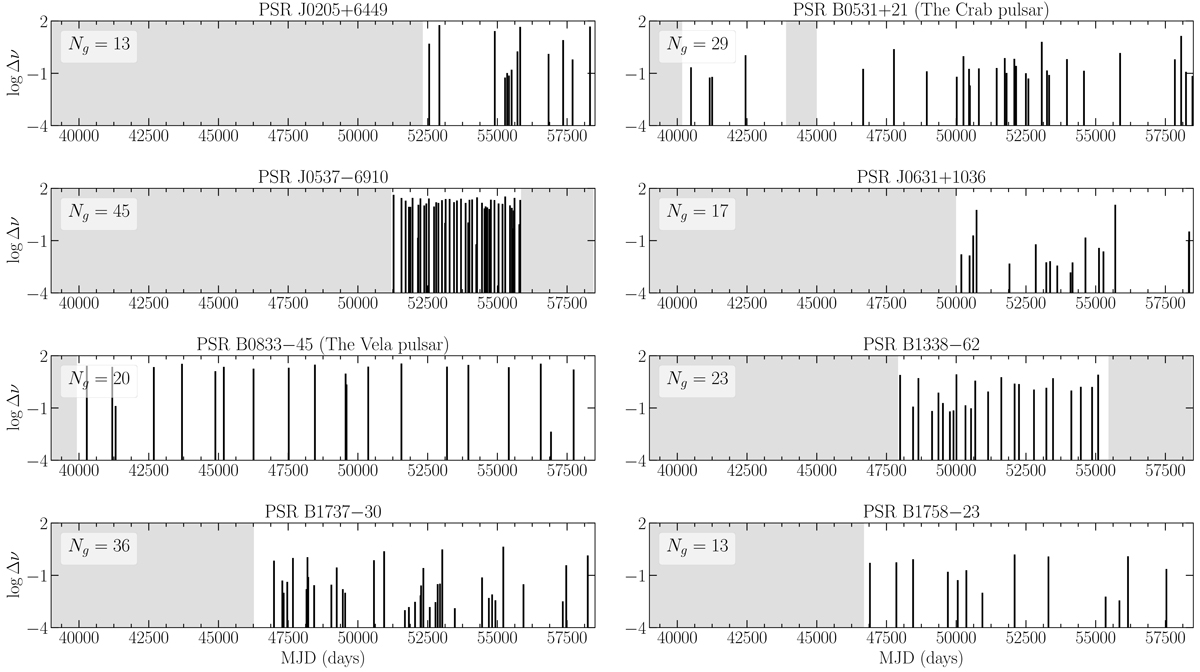
Logarithm (base 10) of glitch sizes Δν (with Δν measured in μHz) as a function of the glitch epoch for the pulsars in the sample. The grey areas mark periods of time in which there were no observations for more than 3 months. Ng is the number of glitches detected in the respective pulsar, until 20 April 2019 (MJD 58593). To build a continuous sample, in the analyses of the Crab pulsar, we only use the 25 glitches after MJD 45000, when daily observations started (Espinoza et al. 2014). All panels share the same scale, in both axes.
Current usage metrics show cumulative count of Article Views (full-text article views including HTML views, PDF and ePub downloads, according to the available data) and Abstracts Views on Vision4Press platform.
Data correspond to usage on the plateform after 2015. The current usage metrics is available 48-96 hours after online publication and is updated daily on week days.
Initial download of the metrics may take a while.