Free Access
Fig. 11.
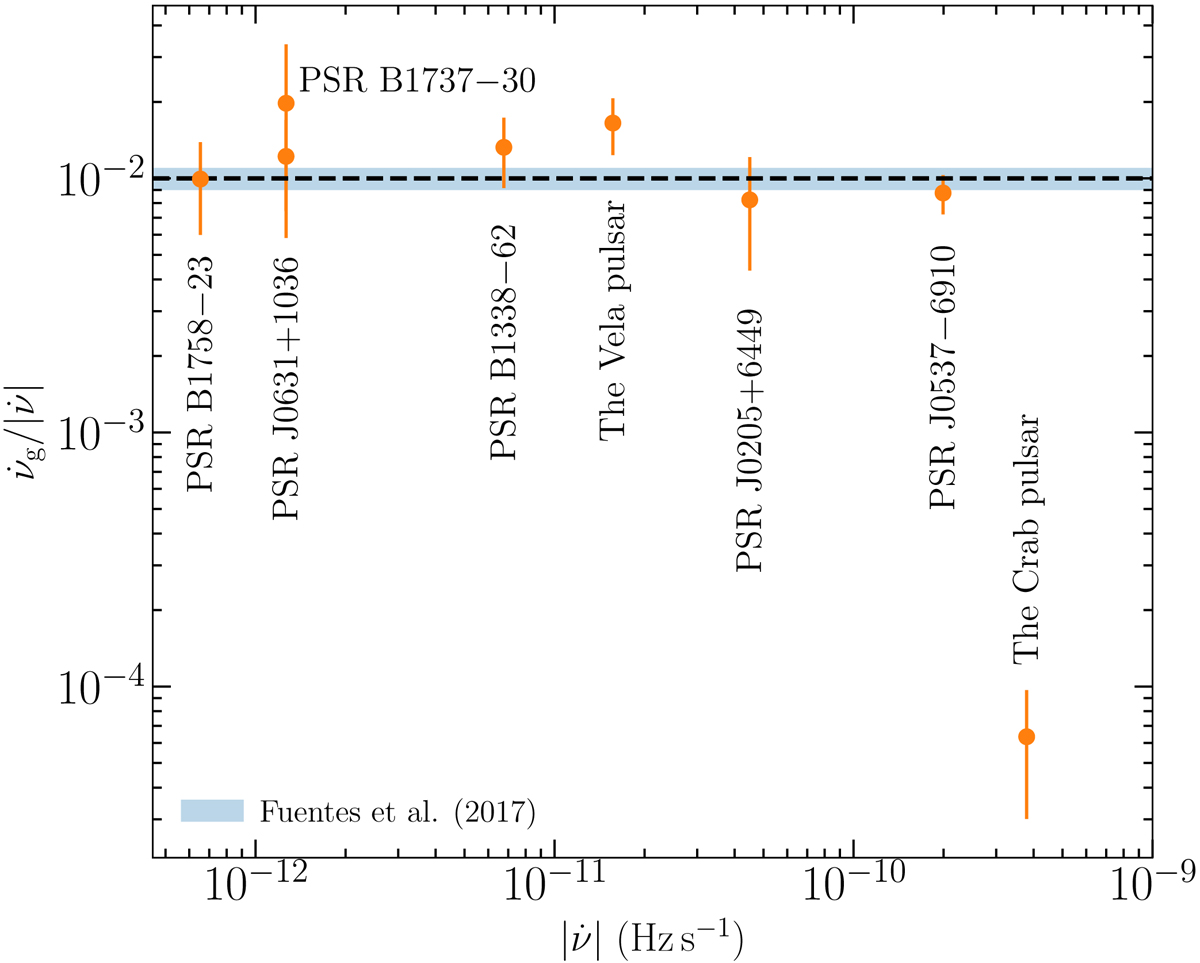
![]() vs.
vs. ![]() for pulsars in our sample. The dashed-line with the blue region correspond to the constant ratio
for pulsars in our sample. The dashed-line with the blue region correspond to the constant ratio ![]() , determined by Fuentes et al. (2017). The error bars were calculated as described in the latter paper.
, determined by Fuentes et al. (2017). The error bars were calculated as described in the latter paper.
Current usage metrics show cumulative count of Article Views (full-text article views including HTML views, PDF and ePub downloads, according to the available data) and Abstracts Views on Vision4Press platform.
Data correspond to usage on the plateform after 2015. The current usage metrics is available 48-96 hours after online publication and is updated daily on week days.
Initial download of the metrics may take a while.