Fig. 10.
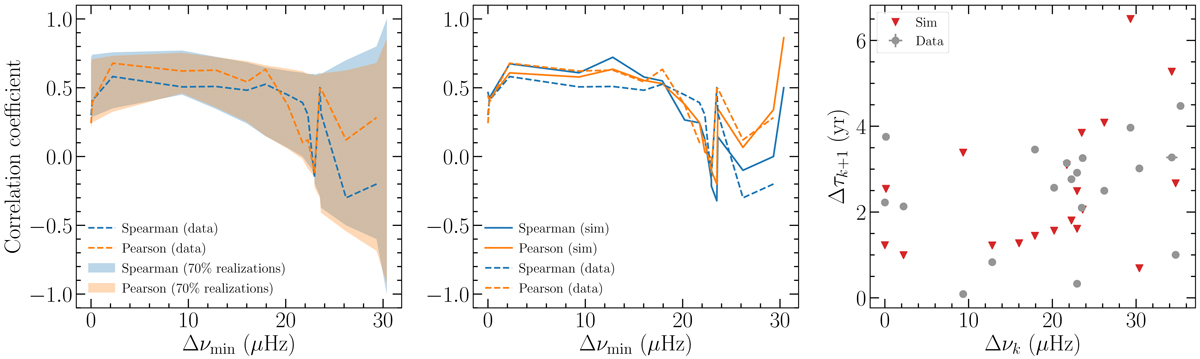
Observations and simulations of the Vela pulsar. Left: shaded regions indicate the values obtained by the 70% closer to the median of all realizations. The observations are overlaid using dashed lines. Middle: comparison of observations (dashed) and one particular realization. Right: Δτk + 1 vs. Δνk for the same realization (red triangles) and for the observations (grey dots). Orange represents rp values and blue represents rs values in all panels. The simulations were performed using ![]() and Δν⋆ = 9.35 μHz.
and Δν⋆ = 9.35 μHz.
Current usage metrics show cumulative count of Article Views (full-text article views including HTML views, PDF and ePub downloads, according to the available data) and Abstracts Views on Vision4Press platform.
Data correspond to usage on the plateform after 2015. The current usage metrics is available 48-96 hours after online publication and is updated daily on week days.
Initial download of the metrics may take a while.