Free Access
Fig. 1.
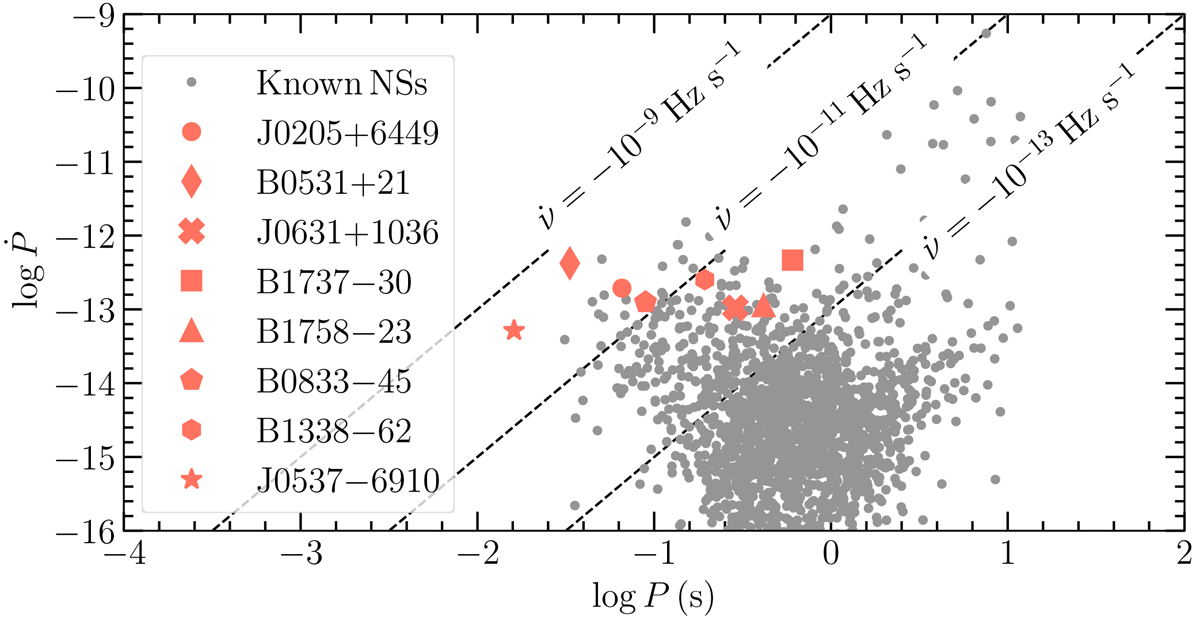
Upper part of the P−Ṗ diagram for all known pulsars. The pulsars in our sample have at least ten detected glitches and are labelled with different symbols. Lines of constant spin-down rate ![]() are shown and labelled. P and Ṗ values were taken from the ATNF pulsar catalogue (http://www.atnf.csiro.au/research/pulsar/psrcat).
are shown and labelled. P and Ṗ values were taken from the ATNF pulsar catalogue (http://www.atnf.csiro.au/research/pulsar/psrcat).
Current usage metrics show cumulative count of Article Views (full-text article views including HTML views, PDF and ePub downloads, according to the available data) and Abstracts Views on Vision4Press platform.
Data correspond to usage on the plateform after 2015. The current usage metrics is available 48-96 hours after online publication and is updated daily on week days.
Initial download of the metrics may take a while.