Fig. 9
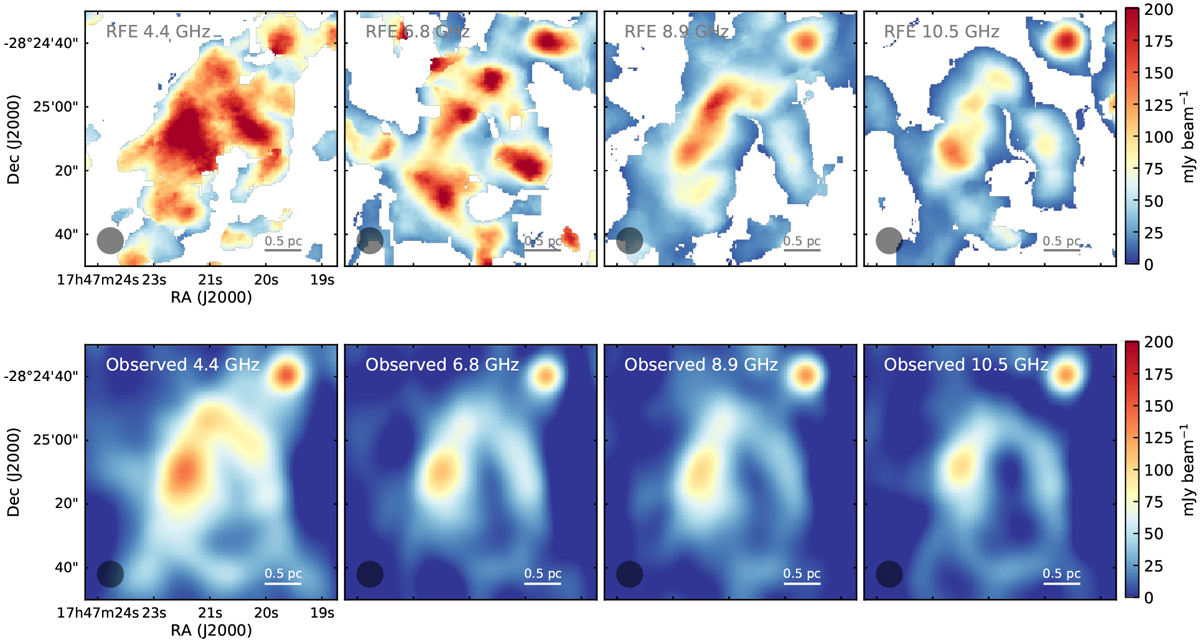
Top panels: free–free continuum maps of the Sgr B2(DS) region derived from the four staked RRLs (RFE as described in Sect. 4.2, following Eq. (1)) at 4.4, 6.8, 8.9, and 10.5 GHz. Bottom panel: observed continuum emission at 4.4, 6.8, 8.9 and 10.5 GHz. For comparison, the observed continuum maps are also smoothed to 8′′, the beam is shown as the shaded circle in the lower left of each plot.
Current usage metrics show cumulative count of Article Views (full-text article views including HTML views, PDF and ePub downloads, according to the available data) and Abstracts Views on Vision4Press platform.
Data correspond to usage on the plateform after 2015. The current usage metrics is available 48-96 hours after online publication and is updated daily on week days.
Initial download of the metrics may take a while.