Fig. 8
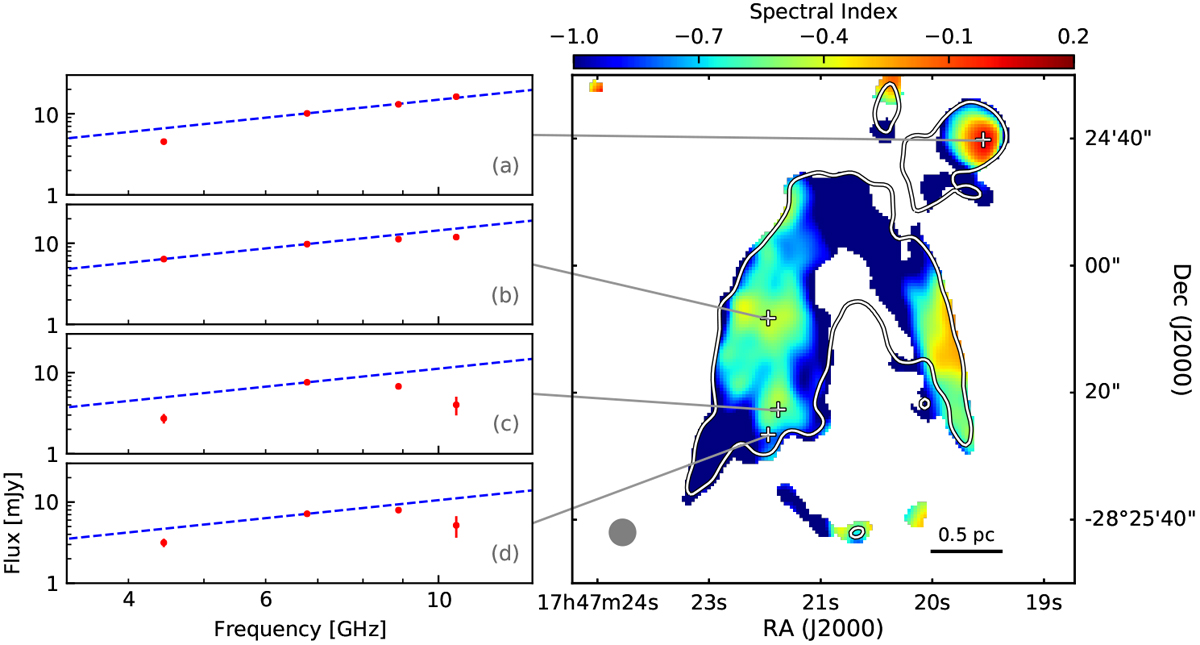
Right: spectral index map of the Sgr B2(DS) as shown in the central panel of Fig. 5. The map of the uncertainty of spectral index is as shown in the right panel of Fig. 4. Left: peak intensities of the four stacked RRLs (see Table 1) at four selected positions. Position (a) corresponds to the well-known H II region AA, while the other positions have been selected to probe regions with negative spectral indices. The dashed line in each panels marks the scenario for LTE under which the flux is proportional to the frequency.
Current usage metrics show cumulative count of Article Views (full-text article views including HTML views, PDF and ePub downloads, according to the available data) and Abstracts Views on Vision4Press platform.
Data correspond to usage on the plateform after 2015. The current usage metrics is available 48-96 hours after online publication and is updated daily on week days.
Initial download of the metrics may take a while.