Fig. 7
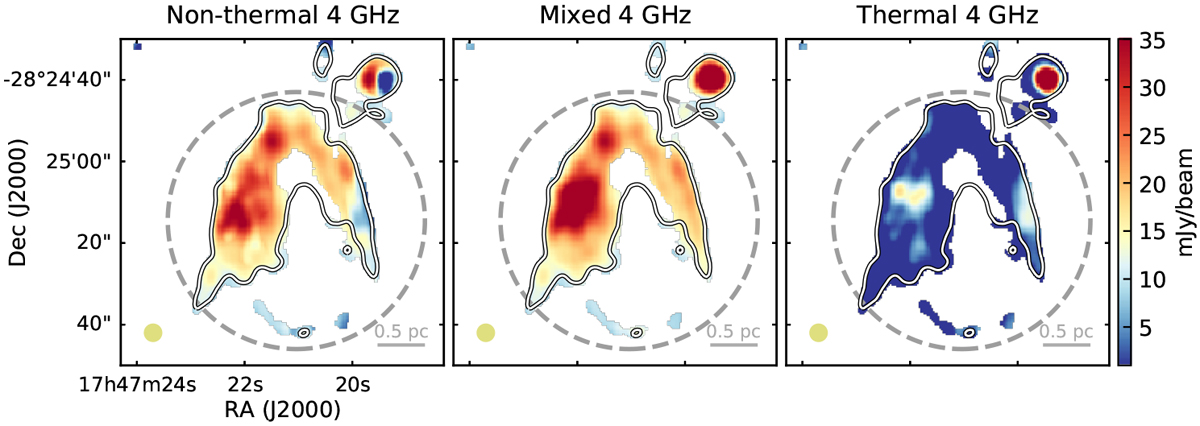
Spatial distribution of the synchrotron (left panel), mixed (central panel) and free–free (right panel) components of DS at 4 GHz. All the three images are obtained after fitting the observed SED with the sum of two power-law functions: Sth (ν) ∝ ν−0.1 and Snt (ν) ∝ ν−0.7 for the thermal and non-thermal components, respectively (see details in Sect. 4.1.2). The contours are the same as in Fig. 5. All panels have a circular beam of 4′′ (shown in the bottom left corner of each panel). The dashed circles indicate the region in which we calculated the flux density of DS (see Sect. 4.1).
Current usage metrics show cumulative count of Article Views (full-text article views including HTML views, PDF and ePub downloads, according to the available data) and Abstracts Views on Vision4Press platform.
Data correspond to usage on the plateform after 2015. The current usage metrics is available 48-96 hours after online publication and is updated daily on week days.
Initial download of the metrics may take a while.