Free Access
Fig. 3
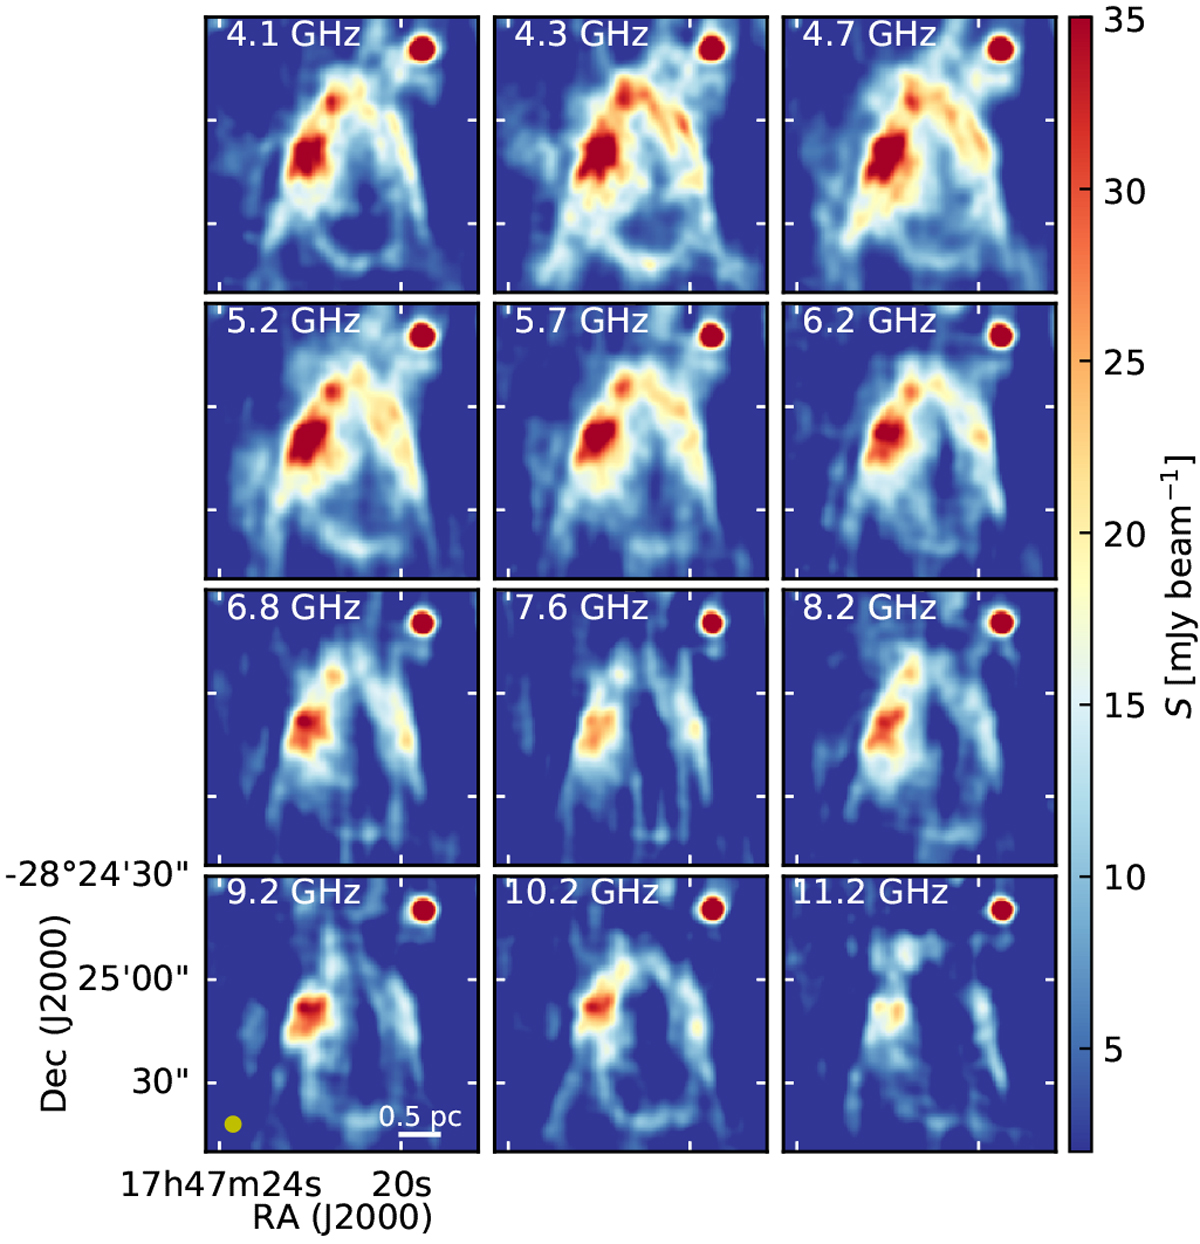
Channel maps of the Sgr B2(DS) region. All the 12 maps have been produced considering the same uv range limited to 0.6–50 kλ, and have been convolved to a circular beam of 4′′. The synthesized beam is shown as a yellow circle in the bottom left panel.
Current usage metrics show cumulative count of Article Views (full-text article views including HTML views, PDF and ePub downloads, according to the available data) and Abstracts Views on Vision4Press platform.
Data correspond to usage on the plateform after 2015. The current usage metrics is available 48-96 hours after online publication and is updated daily on week days.
Initial download of the metrics may take a while.