Fig. B.1
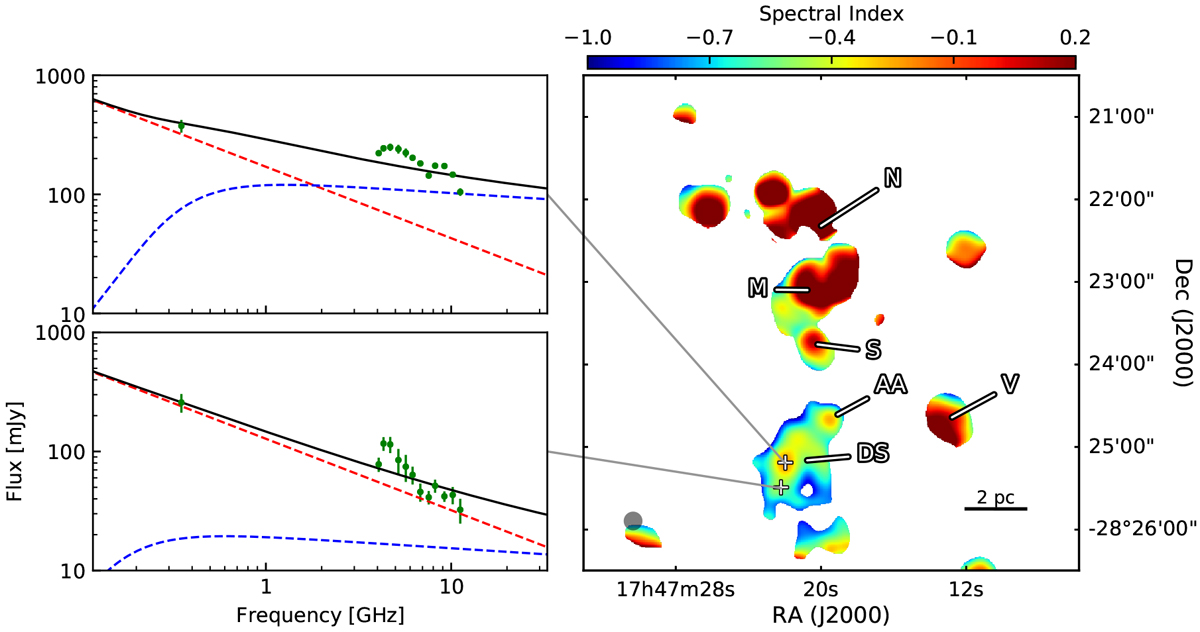
Right panel: spectral index image obtained from the 350 MHz GMRT emission map (Meng et al., in prep.) and the 4 GHz VLA continuum image. Both images have been obtained after limiting the short uv to 0.6 kλ, and convolving the images to a common beam of 12.2′′ × 11.7′′ (PA = 57°), which corresponds to ~25 kλ. Left panel: two examples of SEDs for two selected positions within DS. The observed fluxes are shown with green symbols, all of them measured from images with same spatial filtering and synthesized beam. For illustration, the thermal (blue dashed curve), non-thermal (red dashed line) and the mixed (black solid curve) components are marked. The curves are just qualitative descriptions of the possible contribution of the thermal and non-thermal components, and do not aim at fitting the data.
Current usage metrics show cumulative count of Article Views (full-text article views including HTML views, PDF and ePub downloads, according to the available data) and Abstracts Views on Vision4Press platform.
Data correspond to usage on the plateform after 2015. The current usage metrics is available 48-96 hours after online publication and is updated daily on week days.
Initial download of the metrics may take a while.