Fig. A.1
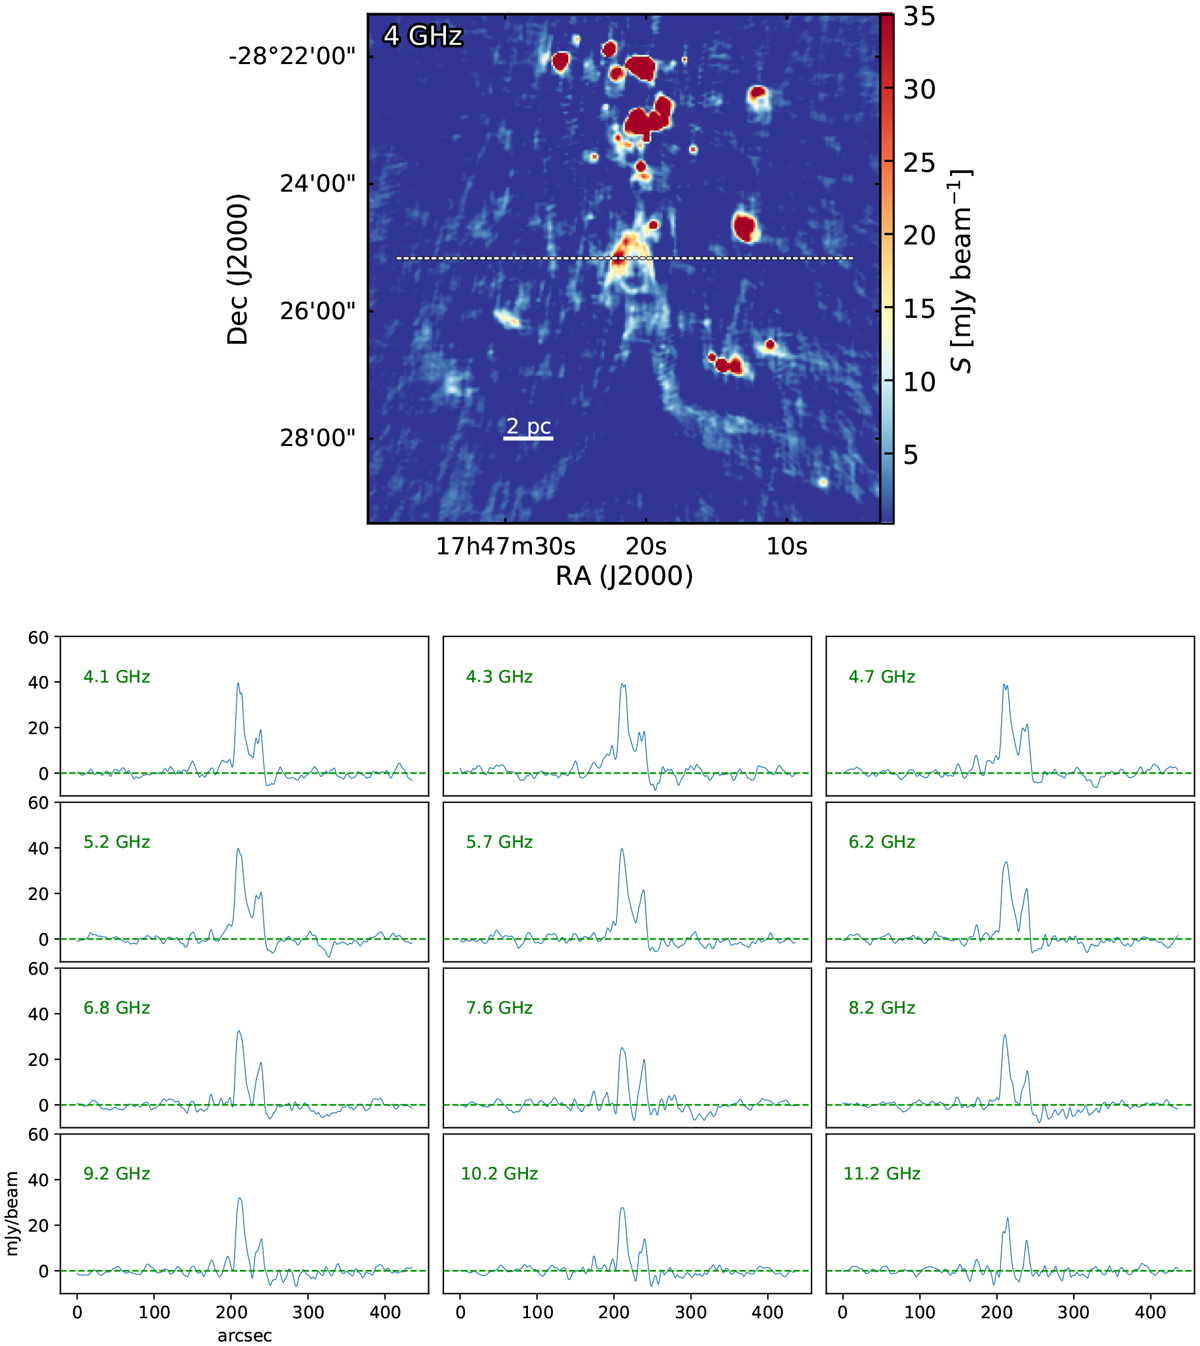
Top panel: continuum emission image of Sgr B2 at 4 GHz. The dashed line indicates the trajectory along which we get the intensity profile. Bottom panels: intensity profiles of the twelve channel maps. The uv limit of the twelve images has been set to 0.6–50 kλ and the images have been convolved to a circular beam of 4′′. The dashed line indicates the zero intensity level.
Current usage metrics show cumulative count of Article Views (full-text article views including HTML views, PDF and ePub downloads, according to the available data) and Abstracts Views on Vision4Press platform.
Data correspond to usage on the plateform after 2015. The current usage metrics is available 48-96 hours after online publication and is updated daily on week days.
Initial download of the metrics may take a while.