Fig. 11
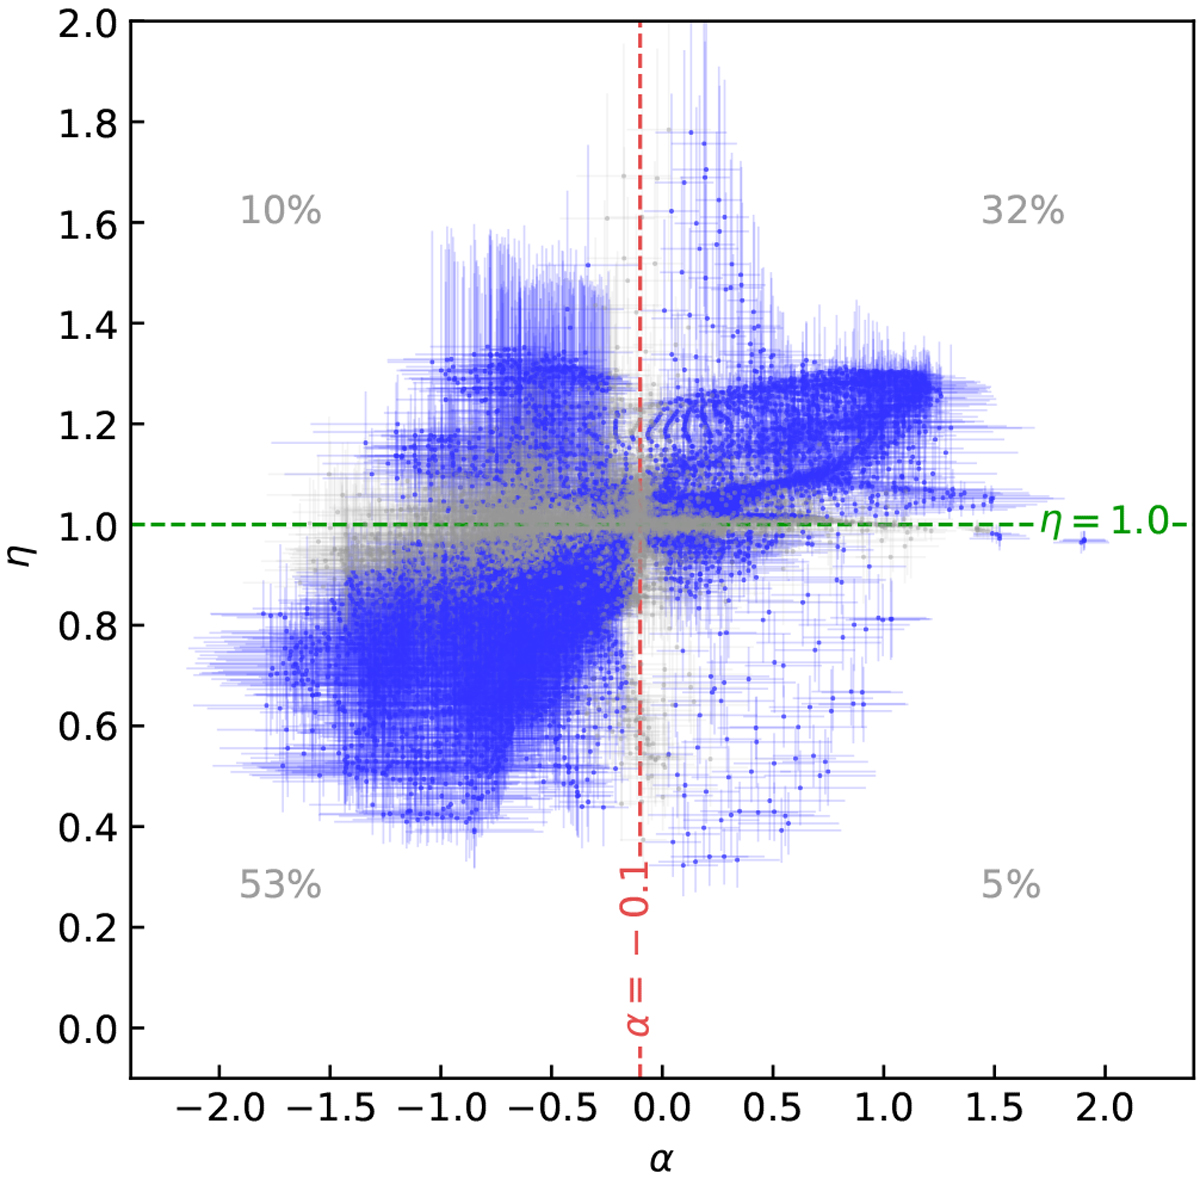
η against spectral index (α). Only the pixels that are in the area marked by the dashed circle in Fig. 10 are taken into account, thus the influence of source AA is excluded. The criterion of non-thermal emission, α = −0.1, is shown with a vertical dashed line, while the criterion of stimulated RRL emission, η = 1, is shown as a horizontal dashed line. These two orthogonal lines divide the whole α–η space into four quadrants. For each quadrant, the number of pixels within it as a percentage of the number of all the pixels is written. The points with error bars crossing the α = −0.1 or η = 1 lines are colored gray and neglected in the statistics.
Current usage metrics show cumulative count of Article Views (full-text article views including HTML views, PDF and ePub downloads, according to the available data) and Abstracts Views on Vision4Press platform.
Data correspond to usage on the plateform after 2015. The current usage metrics is available 48-96 hours after online publication and is updated daily on week days.
Initial download of the metrics may take a while.