Fig. A.5.
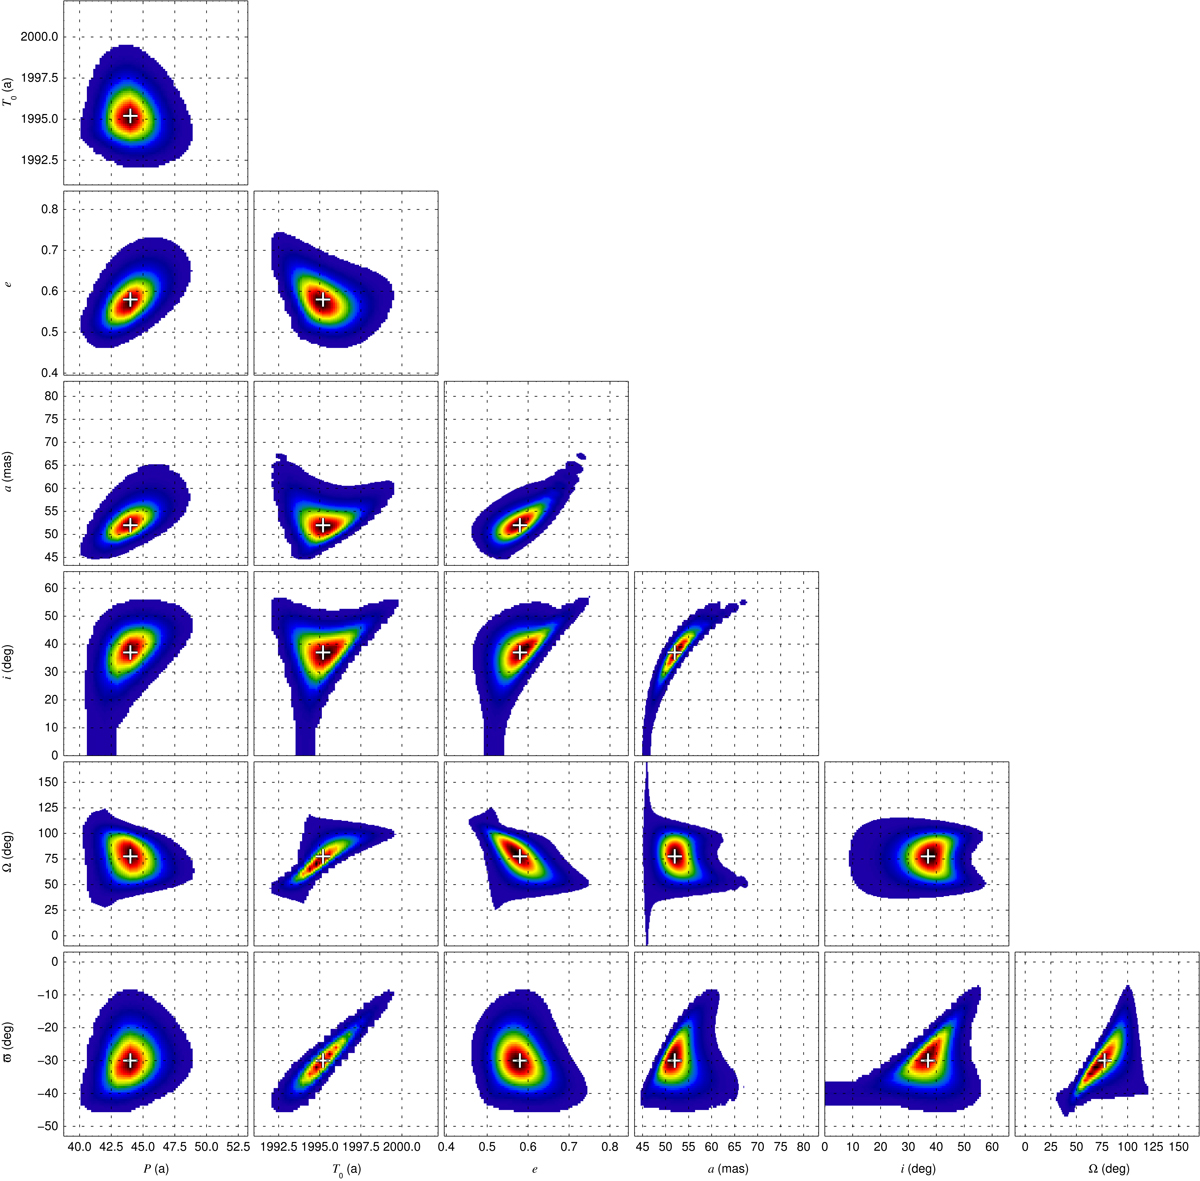
Likelihood plots of every parameter pair for the orbital fitting of HD 193 322 Aa,Ab. The levels plotted range between 0.1% and 100% of the maximum collapsed (from the other five parameters) likelihood in each case using a linear scale. The cross denotes the projection of the seven-parameter mode into that plane, which does not necessary correspond to the maximum of the collapsed likelihood.
Current usage metrics show cumulative count of Article Views (full-text article views including HTML views, PDF and ePub downloads, according to the available data) and Abstracts Views on Vision4Press platform.
Data correspond to usage on the plateform after 2015. The current usage metrics is available 48-96 hours after online publication and is updated daily on week days.
Initial download of the metrics may take a while.