Fig. A.4.
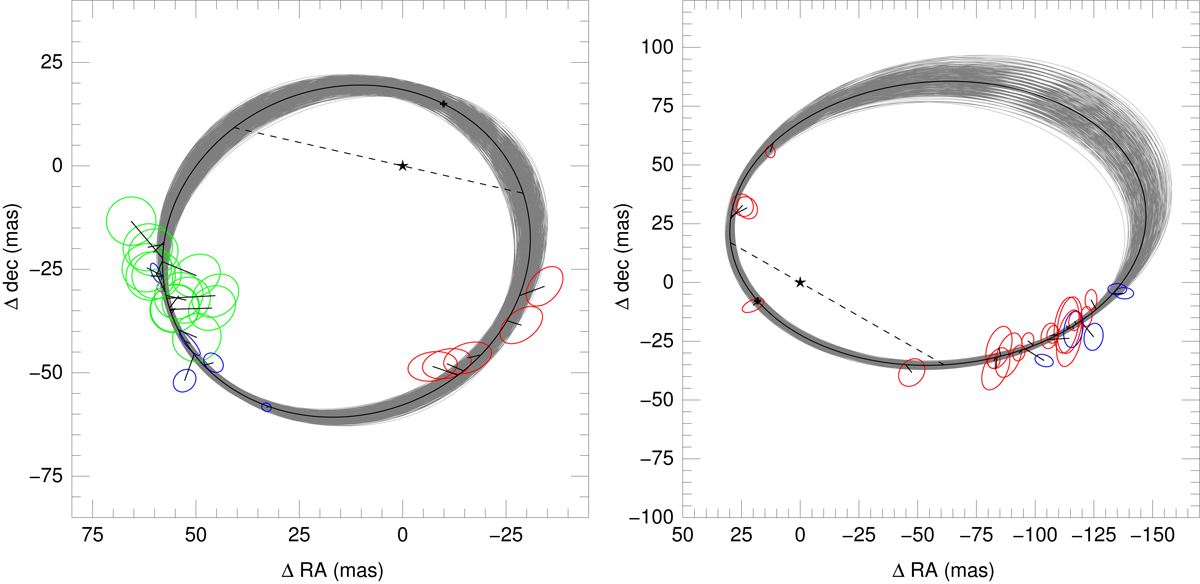
Plane-of-the-sky orbit plots for HD 193 322 Aa,Ab (left) and 15 Mon Aa,Ab (right). The mode (highest likelihood) orbit is shown as a thick black line; a star marks the orbital center, a dashed line the line of nodes, and a cross the periastron. In both cases the motion is counterclockwise and less than a full revolution has been completed since the first data were obtained. In addition to the mode orbit, the top 1000 orbits by likelihood found by the algorithm are plotted using gray thin lines. Ellipses show the measured data points joined by short lines to the predicted position in the mode orbit. A color code is used to indicate the data source. For HD 193 322 Aa,Ab (Table 4), red is used for McAlister et al. (1989), green for ten Brummelaar et al. (2011), magenta for Aldoretta et al. (2015), and blue for Maíz Apellániz et al. (2019). For 15 Mon Aa,Ab (Table 5), blue is used for Maíz Apellániz et al. (2019) and red for the rest of the sources. North is up and east is left. Using the distances derived in this paper, the plotted regions are 126 AU × 126 AU for HD 193 322 Aa,Ab and 158 AU × 158 AU for 15 Mon Aa,Ab.
Current usage metrics show cumulative count of Article Views (full-text article views including HTML views, PDF and ePub downloads, according to the available data) and Abstracts Views on Vision4Press platform.
Data correspond to usage on the plateform after 2015. The current usage metrics is available 48-96 hours after online publication and is updated daily on week days.
Initial download of the metrics may take a while.