Fig. A.1.
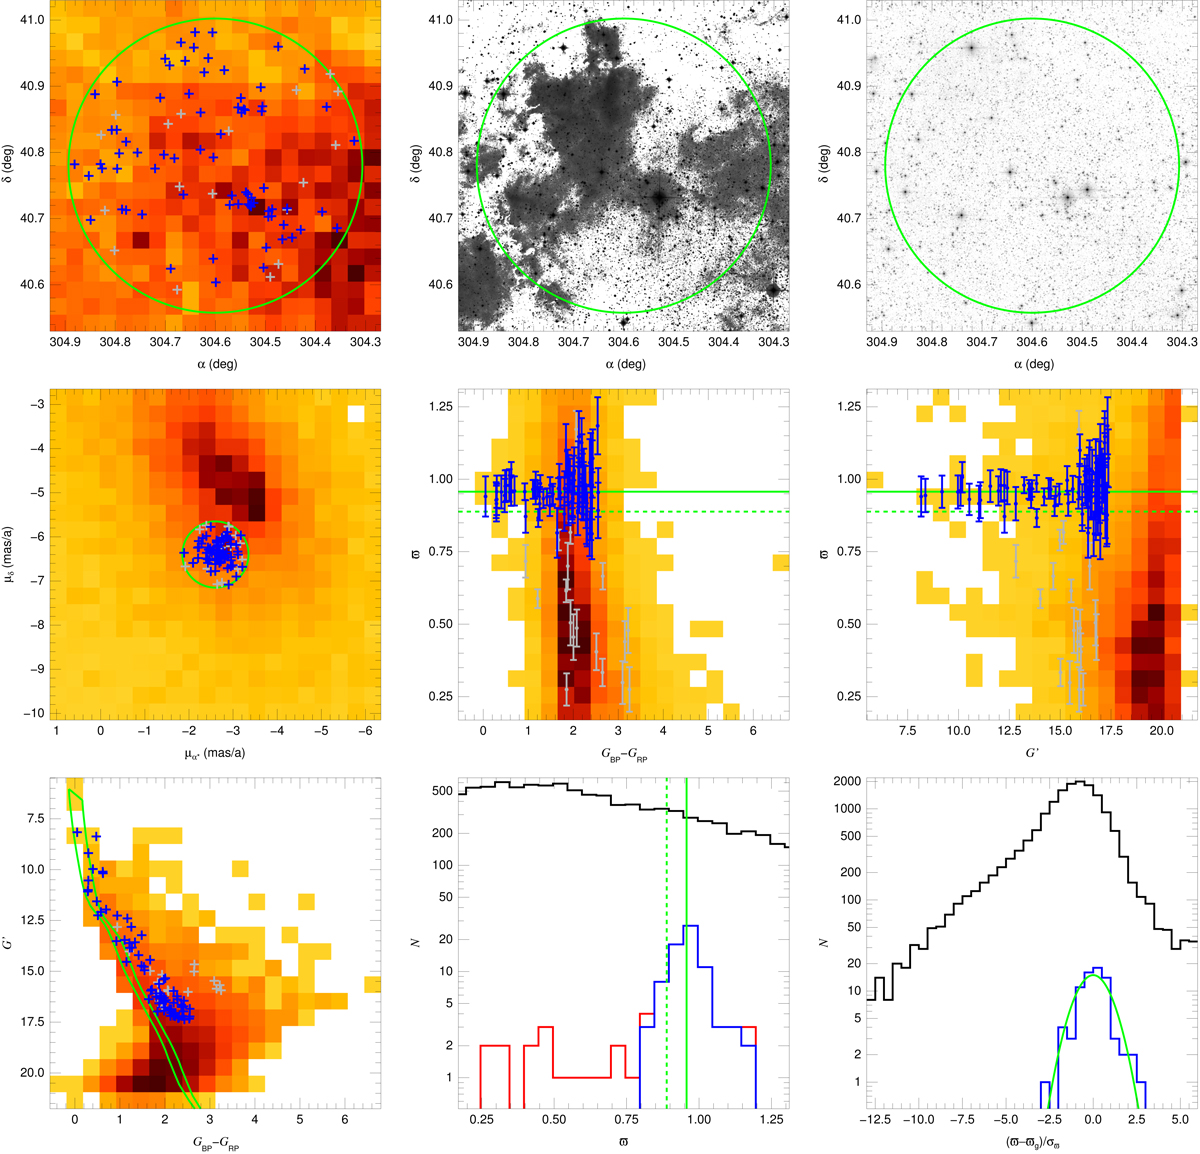
Collinder 419 Gaia DR2 distances and membership results. Top row (left to right): source density diagram, DSS2 blue image, and 2MASS J image. Middle row (left to right): proper motions, color-parallax, and magnitude-parallax diagrams. Bottom row (left to right): color-magnitude diagram, parallax histogram, and normalized-parallax histogram. In all diagrams a heat-type scale (increasing as white-yellow-orange-red-black) is used to indicate the total Gaia DR2 density in a linear scale (except in the CMD, where a log scale is used). In the first four panels the green circle indicates the coordinates or proper motion constraints. In the CMD the green lines show the reference extinguished isochrone (right) and the displaced isochrone used as constraint (left), joined at the top by the extinction trajectory. In all diagrams the blue symbols indicate the objects used in the final sample and the gray symbols those rejected by the normalized parallax criterion. The plotted parallax uncertainties are the external ones. In the parallax histogram black indicate the total Gaia DR2 density, red the sample prior to the application of the normalized parallax criterion, and blue the final sample, while the two green vertical lines delineate the weighted-mean parallax: dotted for ϖg, 0 and solid for ϖg. Black and blue have the same meaning in the normalized parallax histogram, where the green line shows the expected normal distribution.
Current usage metrics show cumulative count of Article Views (full-text article views including HTML views, PDF and ePub downloads, according to the available data) and Abstracts Views on Vision4Press platform.
Data correspond to usage on the plateform after 2015. The current usage metrics is available 48-96 hours after online publication and is updated daily on week days.
Initial download of the metrics may take a while.