Fig. 7
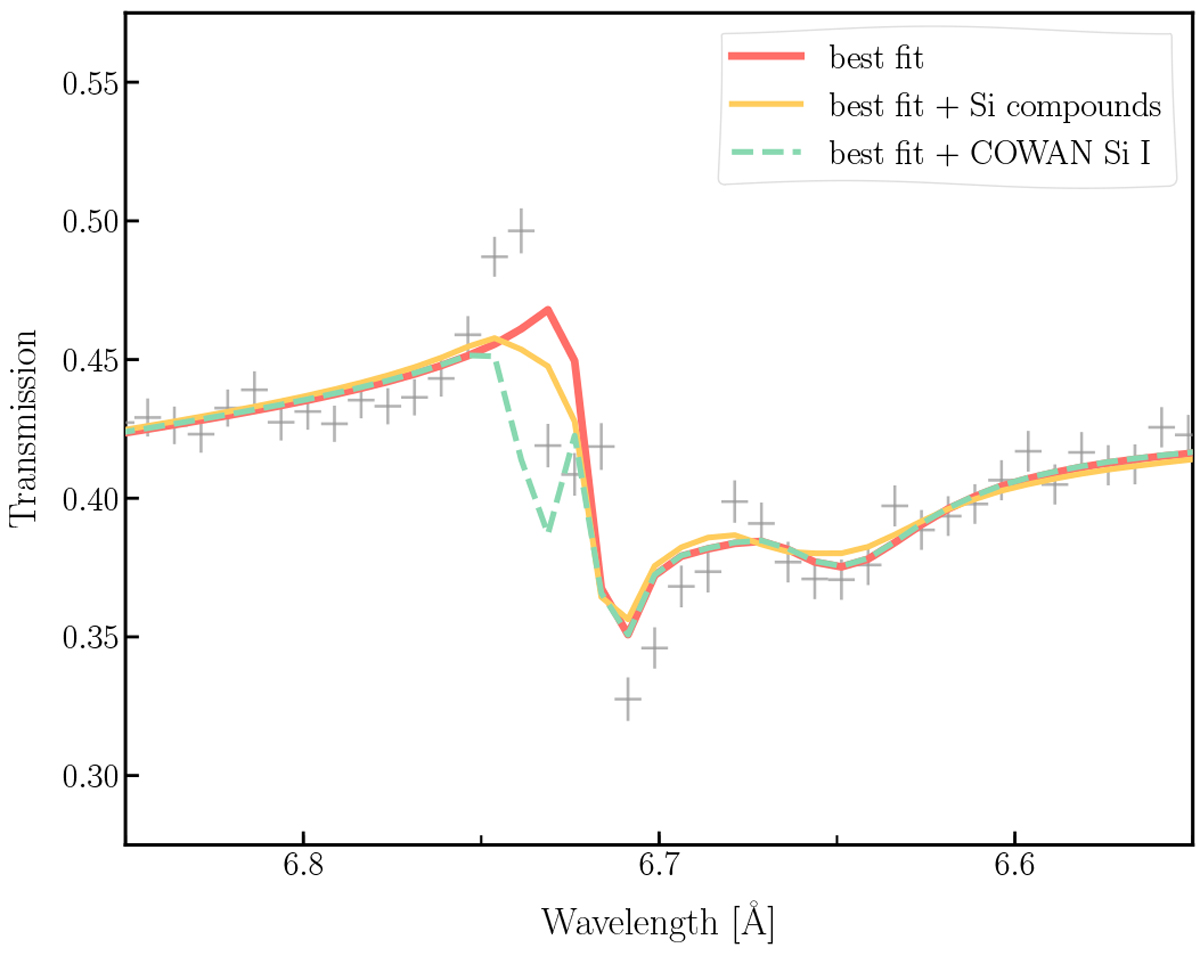
Zoom-in of the silicon K-edge. We represent the best fit with a red solid line. We show, in orange, the model obtained byadding secondary Si-bearing dust candidates presented in the text to the best fit. The green dashed line represents the best fit adding the neutral silicon cross section calculated with the COWAN code. We use a data bin size of ~ 0.04 Å, approximately one-third full width half maximum (in other words the energy resolution of the detector).
Current usage metrics show cumulative count of Article Views (full-text article views including HTML views, PDF and ePub downloads, according to the available data) and Abstracts Views on Vision4Press platform.
Data correspond to usage on the plateform after 2015. The current usage metrics is available 48-96 hours after online publication and is updated daily on week days.
Initial download of the metrics may take a while.