Free Access
Fig. 6
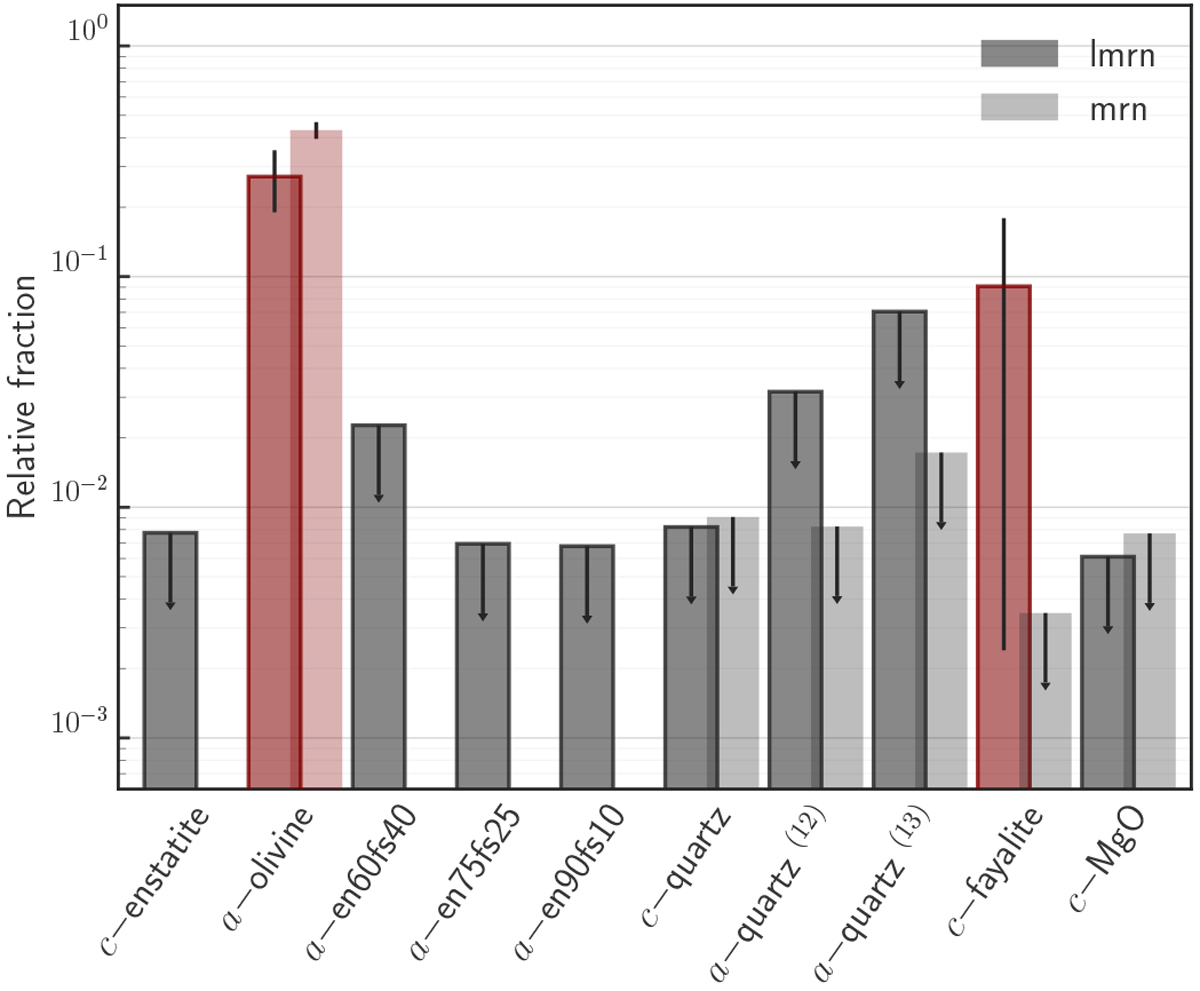
Bar plot of the relative abundance for each dust species calculated considering AIC-selected models. Darker bars represent models with a LMRN size distribution; lighter bars refer to MRN models. We highlight the dust species with a constrained relative fraction with red filled bars.
Current usage metrics show cumulative count of Article Views (full-text article views including HTML views, PDF and ePub downloads, according to the available data) and Abstracts Views on Vision4Press platform.
Data correspond to usage on the plateform after 2015. The current usage metrics is available 48-96 hours after online publication and is updated daily on week days.
Initial download of the metrics may take a while.