Fig. 5
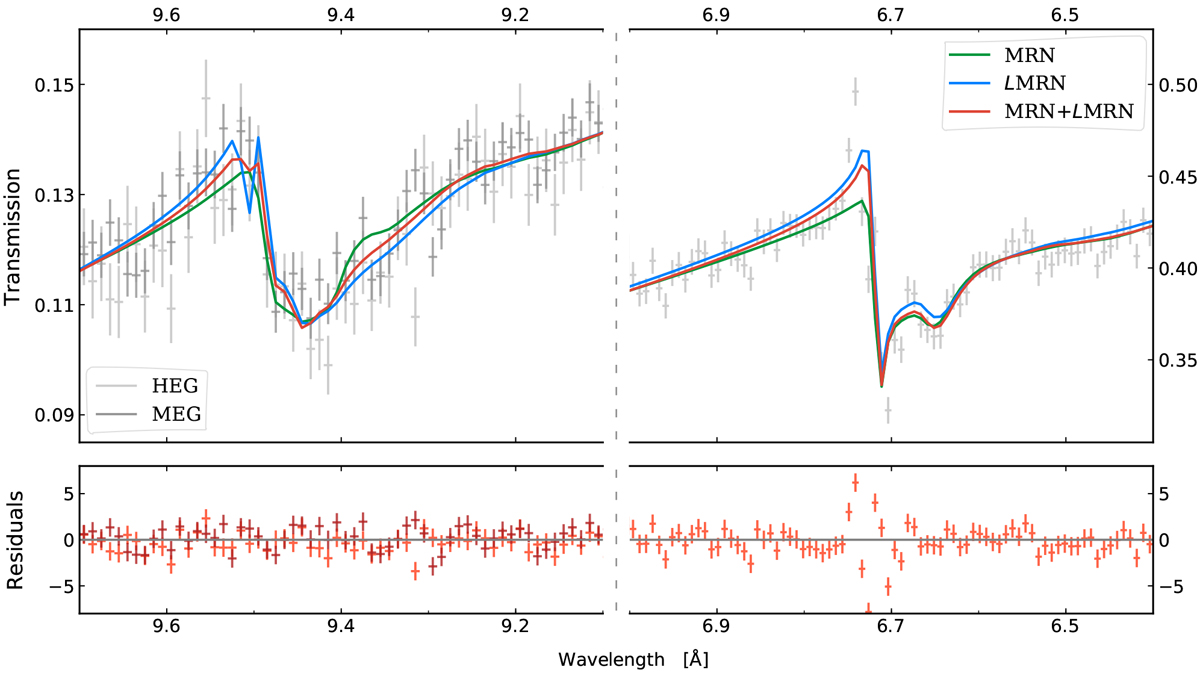
Top panel: magnesium and silicon K-edges of GX 3+1. The HEG and MEG data are shown in light and dark grey, respectively. We do not consider MEG data for the Si K-edge because of the pile-up contamination. We fit the two edges using models with different grain size distributions: MRN models only in green, LMRN models only in blue, and both MRN and LMRN models in red. Bottom panel: we show the residuals defined as (observed-model)/error of the best fit obtained using MRN and LMRN models. The HEG and MEG data are shown in light and dark red, respectively. The data are stacked and binned for display purposes.
Current usage metrics show cumulative count of Article Views (full-text article views including HTML views, PDF and ePub downloads, according to the available data) and Abstracts Views on Vision4Press platform.
Data correspond to usage on the plateform after 2015. The current usage metrics is available 48-96 hours after online publication and is updated daily on week days.
Initial download of the metrics may take a while.