Fig. 4
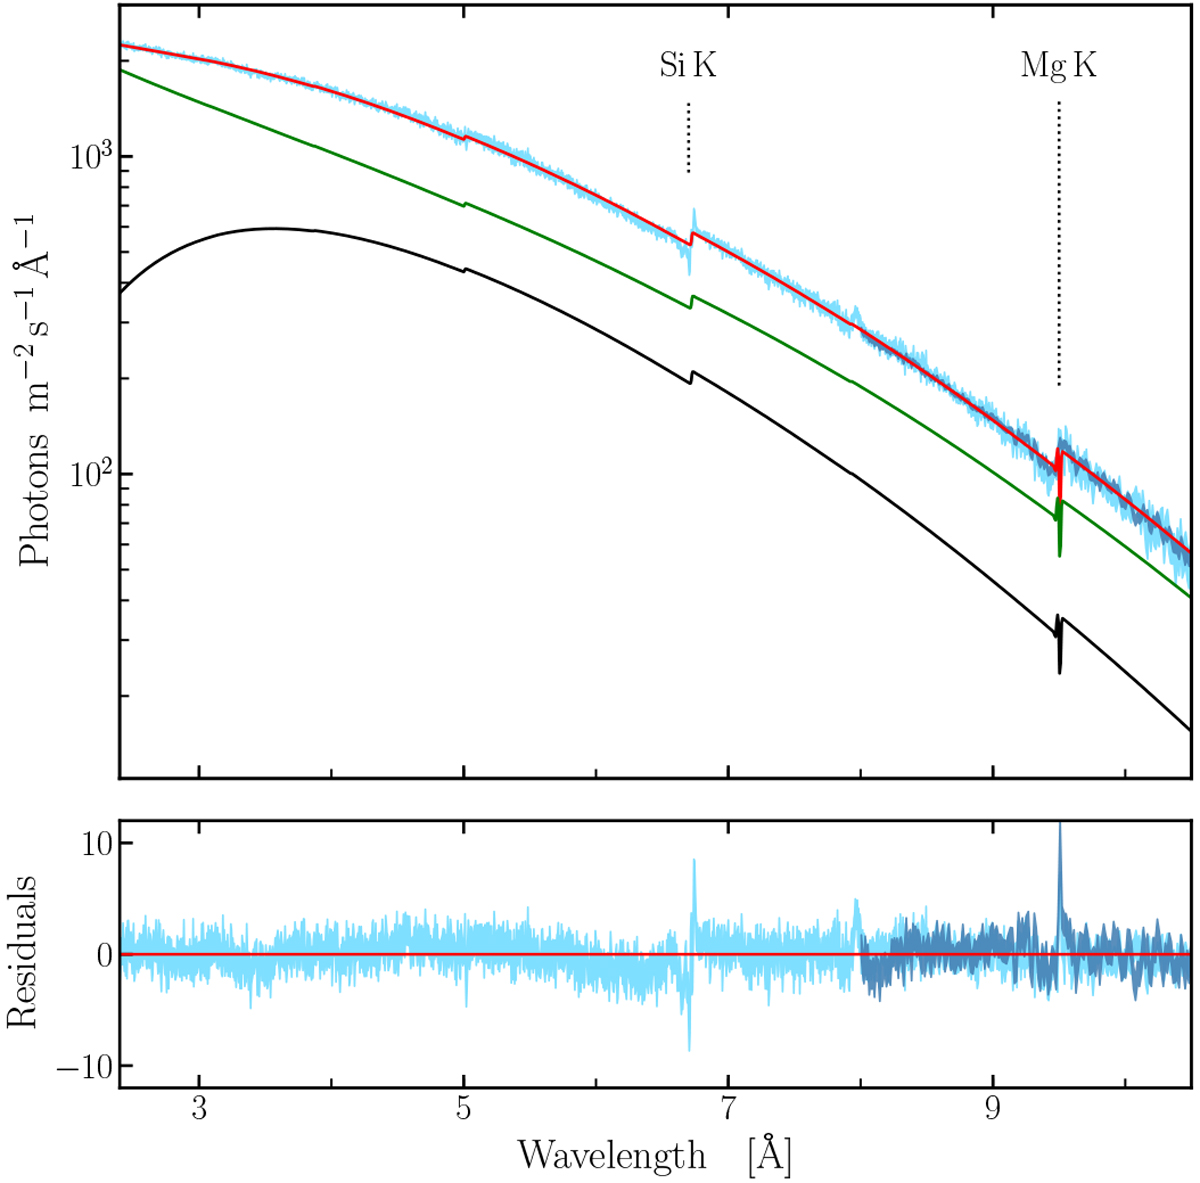
Continuum of GX 3+1. HEG (light blue) and MEG (dark blue) data from seven datasets were used to fit the continuum. We stacked and binned the observations for display purpose only. The average fit of the seven data sets is shown with a red solid line. The model consists of a black body (in black) and a power law (green) with a photoelectric absorption component with NH ≃ 1.9 × 1022 cm−2. In the bottom panel we show the relative residuals defined as (observed-model)/error. The residual around 8 Å is due to the uncertainty on calibration for the aluminium K-edge.
Current usage metrics show cumulative count of Article Views (full-text article views including HTML views, PDF and ePub downloads, according to the available data) and Abstracts Views on Vision4Press platform.
Data correspond to usage on the plateform after 2015. The current usage metrics is available 48-96 hours after online publication and is updated daily on week days.
Initial download of the metrics may take a while.