Fig. 1
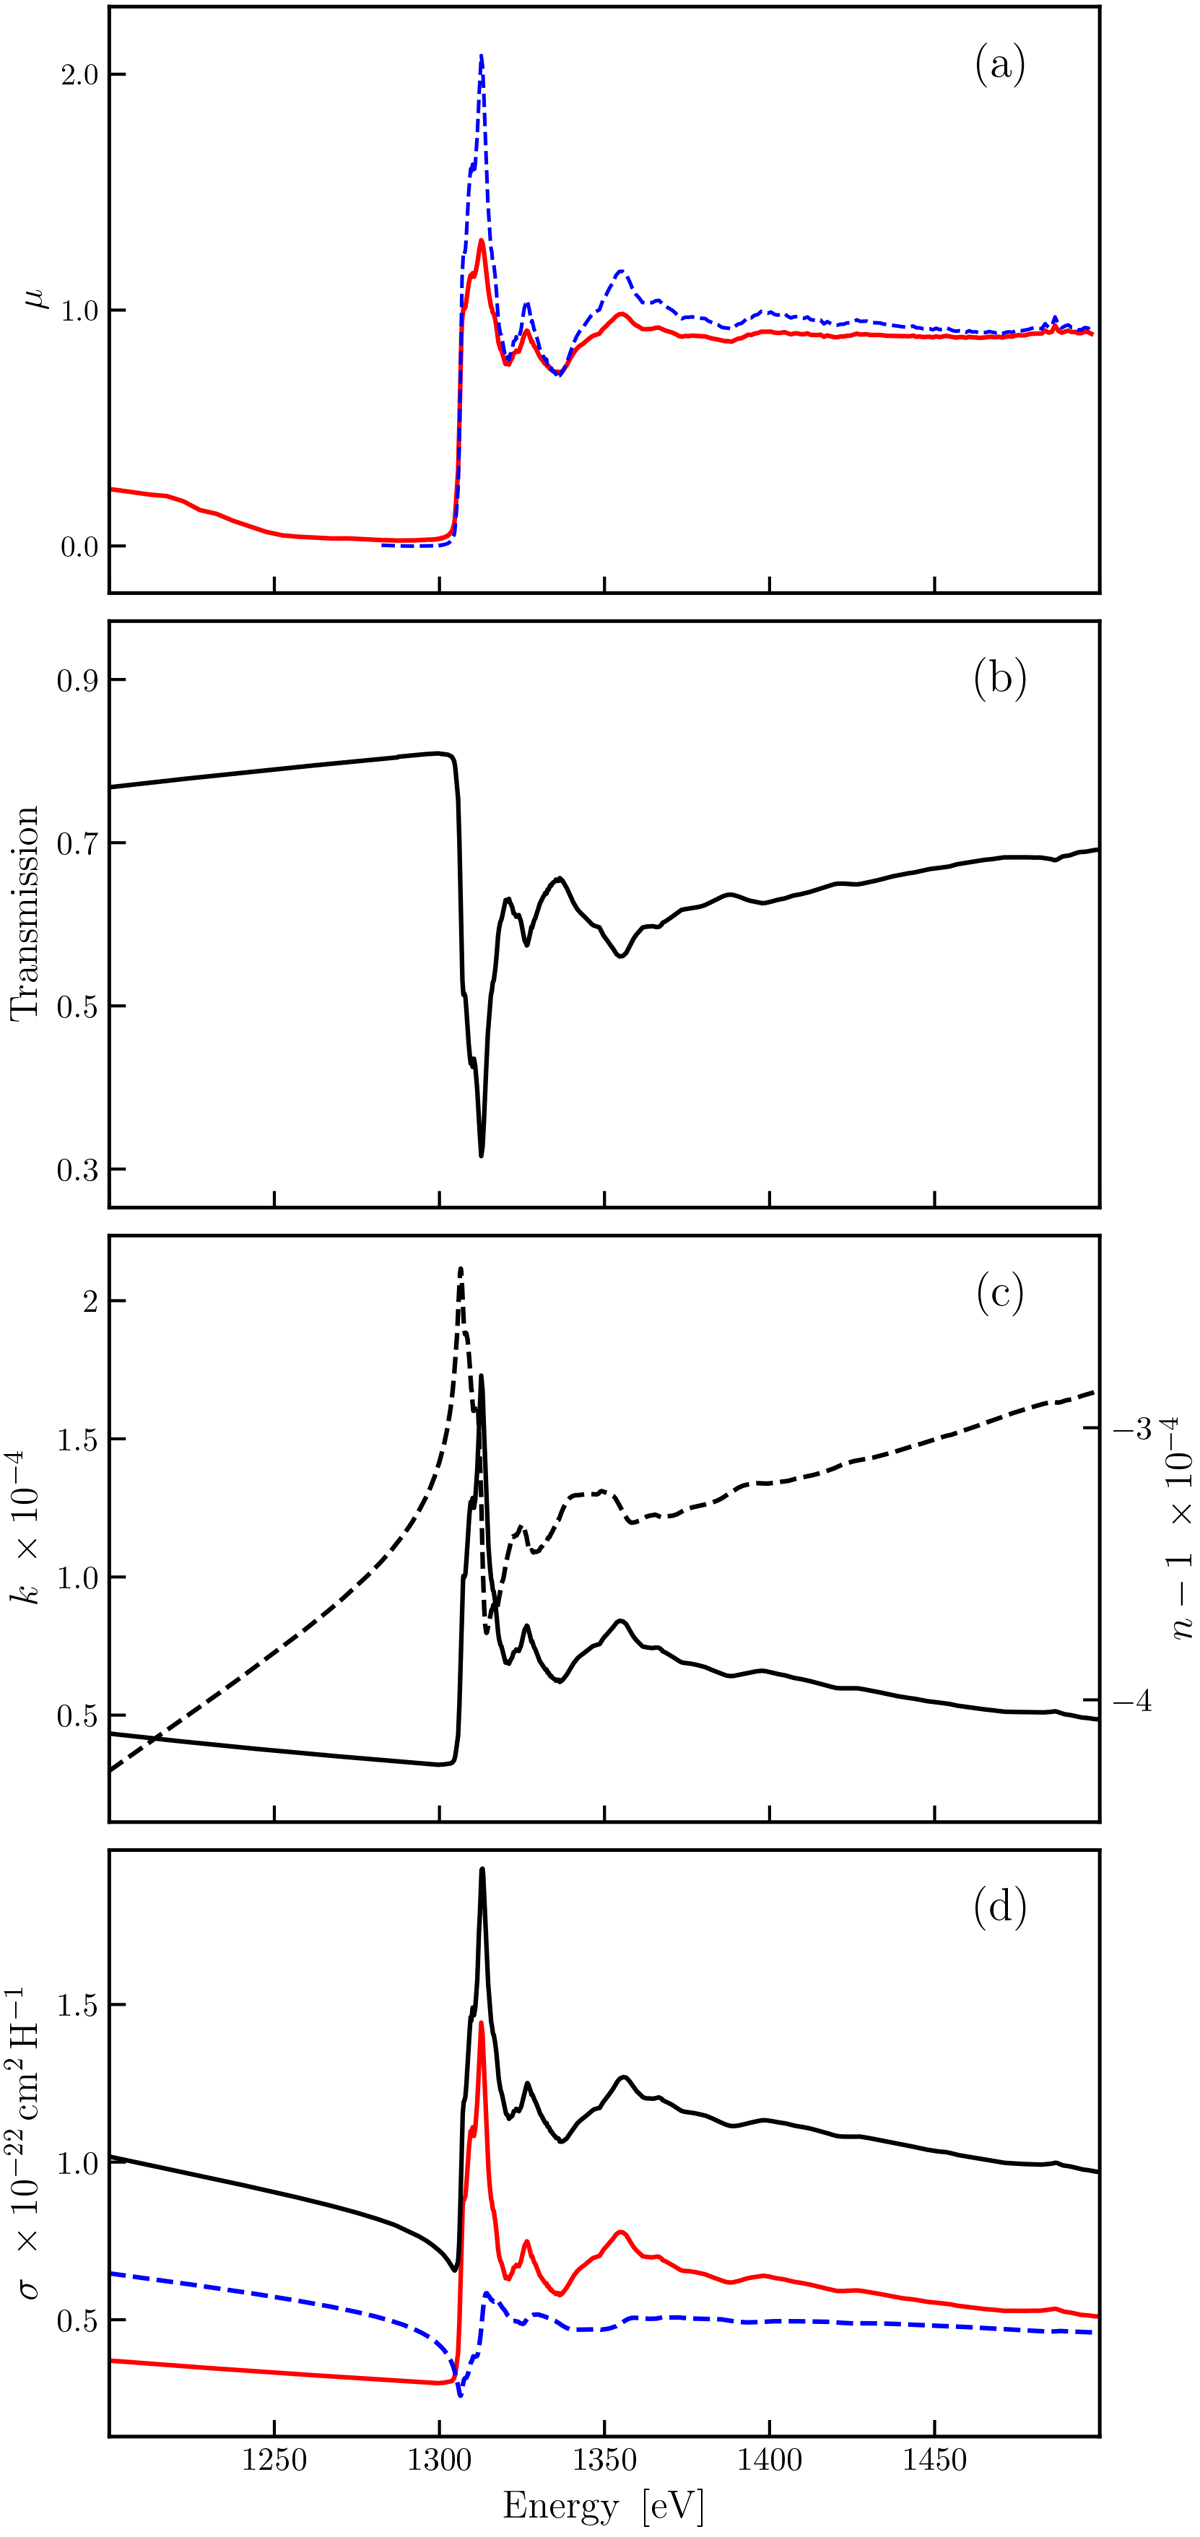
Representation of data analysis for the forsterite Mg2SiO4. From top to bottom: (a) self-absorption correction: the synchrotron raw data (red solid line) and the signal corrected with the FLUO tool (blue dashed line).(b) Transmission for a thin layer (τ = 0.5 μm): the measured edge with XAFS (in black) are normalised using the tabulates values from Henke et al. (1993). (c) Optical constants: k is represented with the solid line while n − 1 with the dashed line (in units of 10−4). (d) The extinction (black solid), absorption (red solid), and scattering (blue dashed) cross sections per hydrogen nucleus for the Mathis, Rumpl, & Nordsieck (1977) dust model.
Current usage metrics show cumulative count of Article Views (full-text article views including HTML views, PDF and ePub downloads, according to the available data) and Abstracts Views on Vision4Press platform.
Data correspond to usage on the plateform after 2015. The current usage metrics is available 48-96 hours after online publication and is updated daily on week days.
Initial download of the metrics may take a while.