Fig. 8.
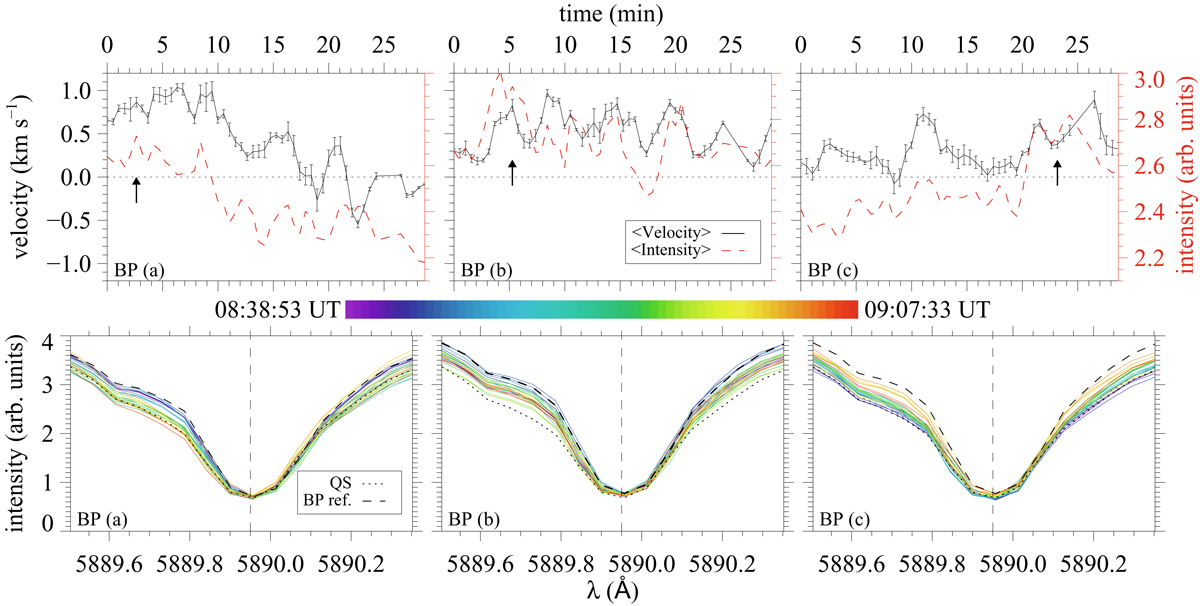
Upper row: time evolution of the average LOS velocities computed within the 5 × 5 px2 green box shown in Fig. 7. The vertical bars indicate ± the standard deviation of the velocities within the same box. The overplotted red dashed line shows the average intensity in the blue wing of Na I D2 inside of the same green box. The arrow marks the time of simultaneous GRIS data. Lower row: average intensity profile generated within the same green box. The color code indicates the time of each profile. The dashed vertical line marks the wavelength at rest. The dotted profile represents the quiet-Sun profile whereas the dashed one corresponds in time to the average profile marked with the arrows in the above panels.
Current usage metrics show cumulative count of Article Views (full-text article views including HTML views, PDF and ePub downloads, according to the available data) and Abstracts Views on Vision4Press platform.
Data correspond to usage on the plateform after 2015. The current usage metrics is available 48-96 hours after online publication and is updated daily on week days.
Initial download of the metrics may take a while.