Fig. 7.
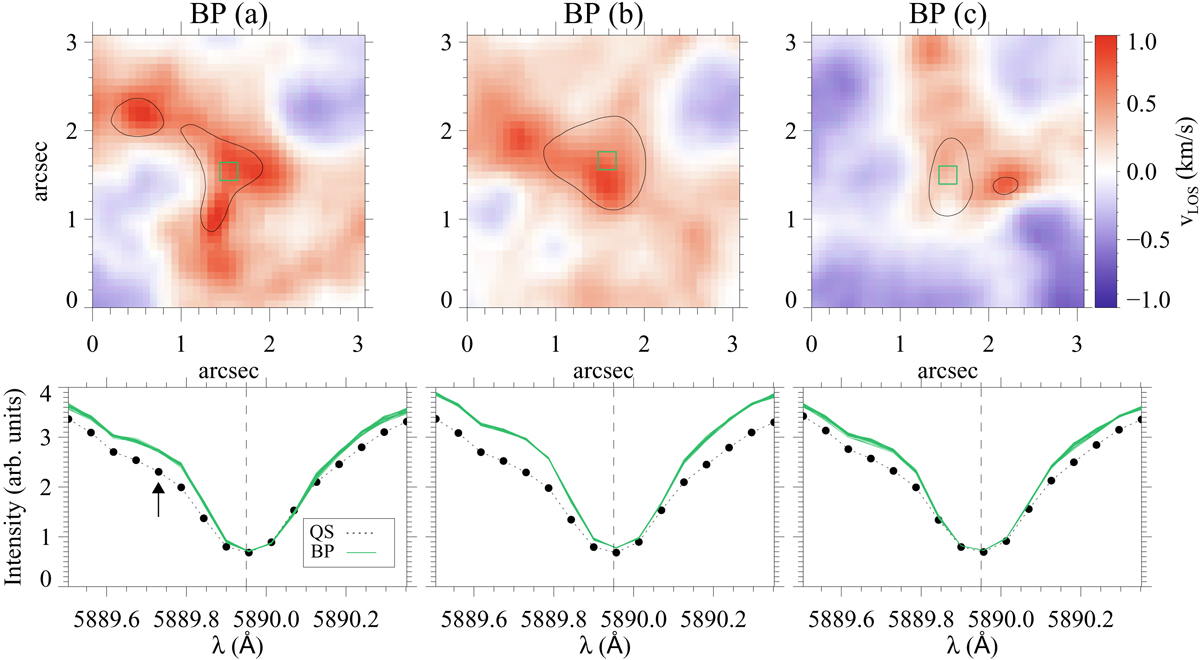
Upper row: Doppler shifts for BPs (a)–(c) inside the zoomed region-of-interest, using the bisector method at a line depth, which corresponds to about Na I D2λ0 − 0.22 Å. The arrow in the lower left panel illustrates the depth at which the bisector was computed. Black contours mark the area of the BP. Lower panels: average quiet-Sun profile (dotted line) within the whole FOV (Fig. 1). The large dots correspond to the acquired filtergrams along the Na I D2 line with GFPI. The green solid lines exhibit the brightest 25 profiles belonging to the green box in the upper panels. The dashed vertical line marks the wavelength at rest.
Current usage metrics show cumulative count of Article Views (full-text article views including HTML views, PDF and ePub downloads, according to the available data) and Abstracts Views on Vision4Press platform.
Data correspond to usage on the plateform after 2015. The current usage metrics is available 48-96 hours after online publication and is updated daily on week days.
Initial download of the metrics may take a while.