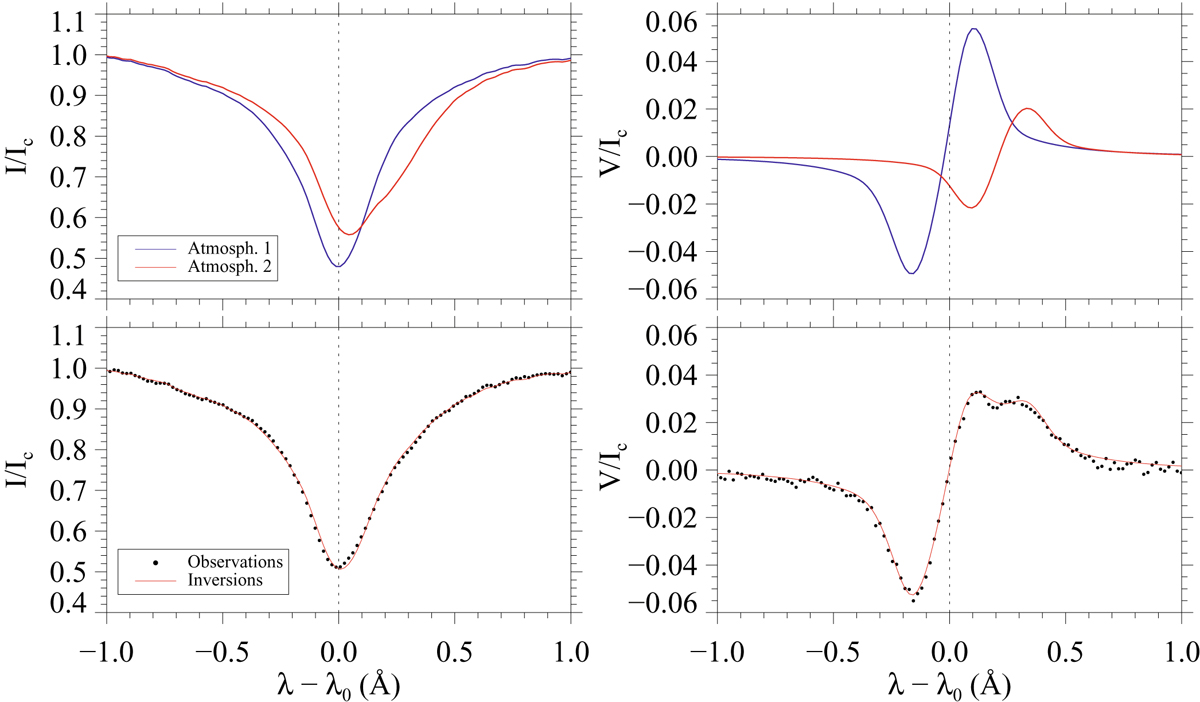
Fig. 6.
Representative example of Stokes I/Ic and V/Ic profiles of a highly redshifted pixel close to the center of BP (b). The profiles are taken from inside of the white contour of Fig. 5. Lower two panels: observations (black dots) and best fit (solid red line) from a two-component SIR inversion. Upper two panels: synthesized profiles arising from the two atmospheric models obtained with SIR which coexist within the same resolution element. Atmosphere 1 (blue solid line) and 2 (red solid line) have a filling factor of about 0.7 and 0.3, respectively. The inferred average LOS velocity and inclination between −1.0 ≥ log τ ≥ −2.5 from this particular fit is vLOS, 1 ∼ −1 km s−1 and γ1 ∼ 172° and vLOS, 2 ∼ 6 km s−1 and γ2 ∼ 169°, for atmospheres 1 and 2, respectively.
Current usage metrics show cumulative count of Article Views (full-text article views including HTML views, PDF and ePub downloads, according to the available data) and Abstracts Views on Vision4Press platform.
Data correspond to usage on the plateform after 2015. The current usage metrics is available 48-96 hours after online publication and is updated daily on week days.
Initial download of the metrics may take a while.