Fig. 5.
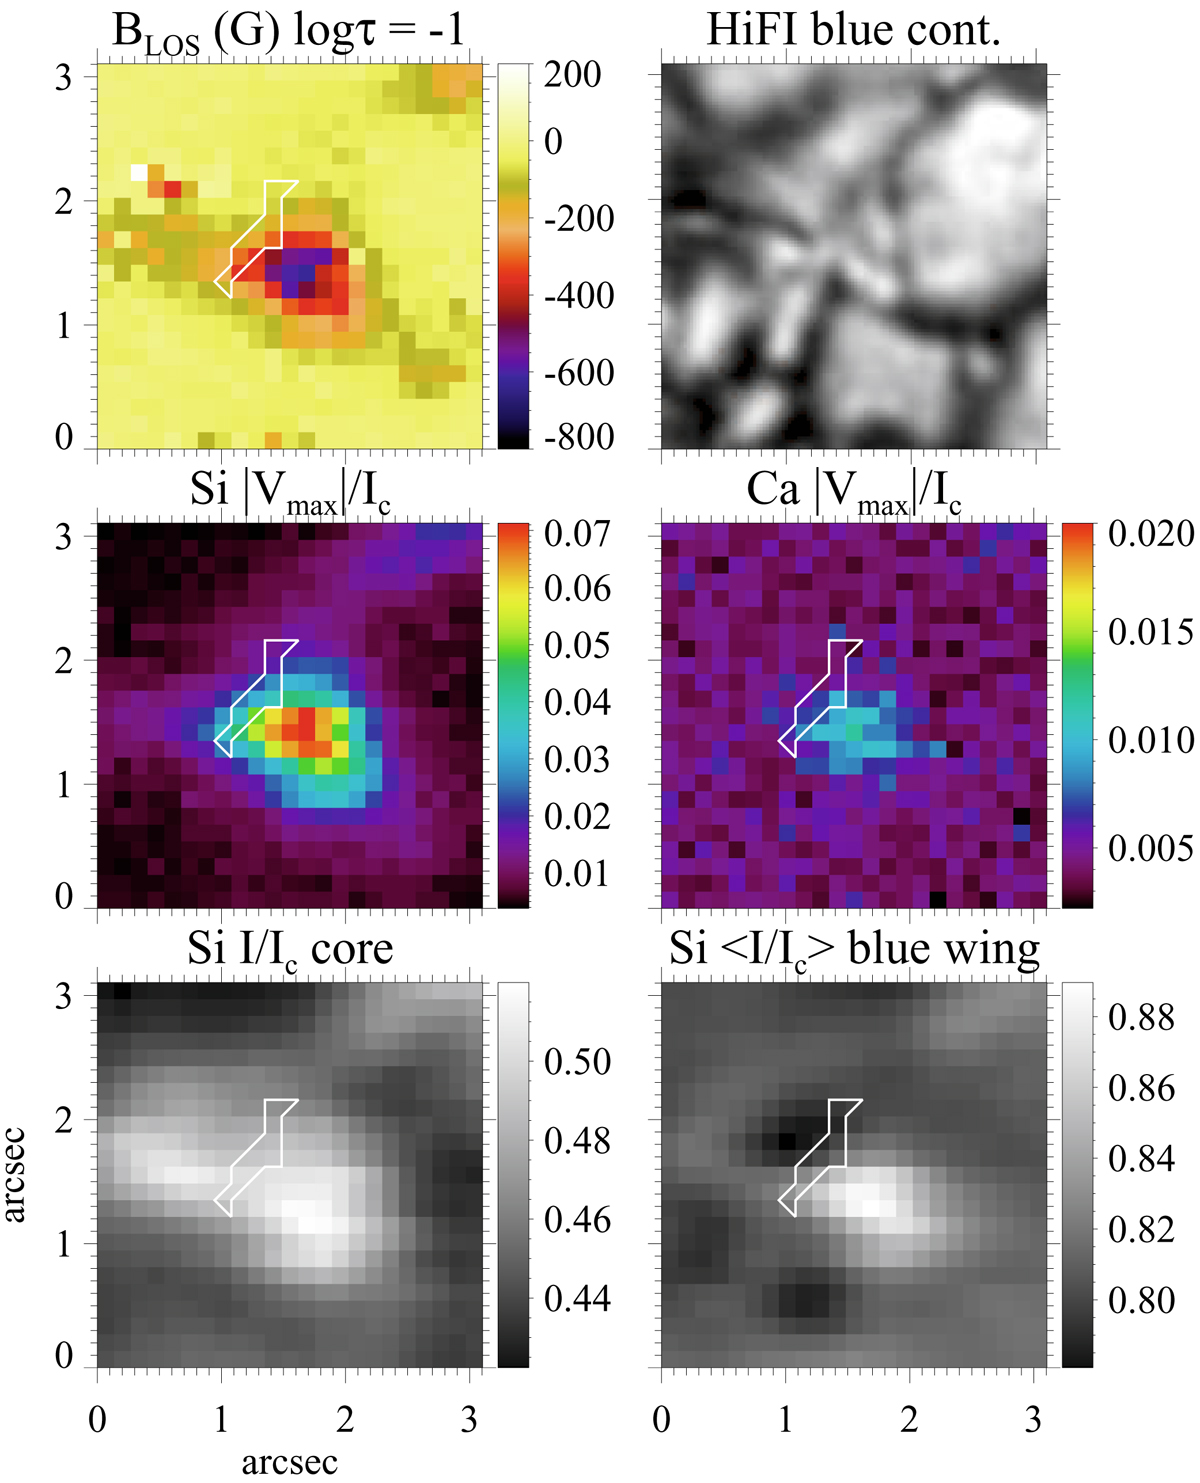
Zoom of the region-of-interest of 3″ × 3″ belonging to BP (b) from Fig. 2. Lower two panels: intensity of the Si I line in the core (left) and averaged blue wing at around λ0 − 0.35 Å (right), where BPs are well detected. Middle left (right) panel: unsigned maximum signal in Stokes Vmax/Ic from the Si I 10827 Å (Ca I 10839 Å) line. Upper left panel: longitudinal magnetic field at log τ = −1 inferred from the Si I inversions. A zoom of the HiFI blue-continuum image showing the fine structure is exhibited in the upper right panel. Pixels enclosed inside the white contours show atypical Si I Stokes V profiles, with two discernible red lobes like the example shown in Fig. 6.
Current usage metrics show cumulative count of Article Views (full-text article views including HTML views, PDF and ePub downloads, according to the available data) and Abstracts Views on Vision4Press platform.
Data correspond to usage on the plateform after 2015. The current usage metrics is available 48-96 hours after online publication and is updated daily on week days.
Initial download of the metrics may take a while.