Fig. 3.
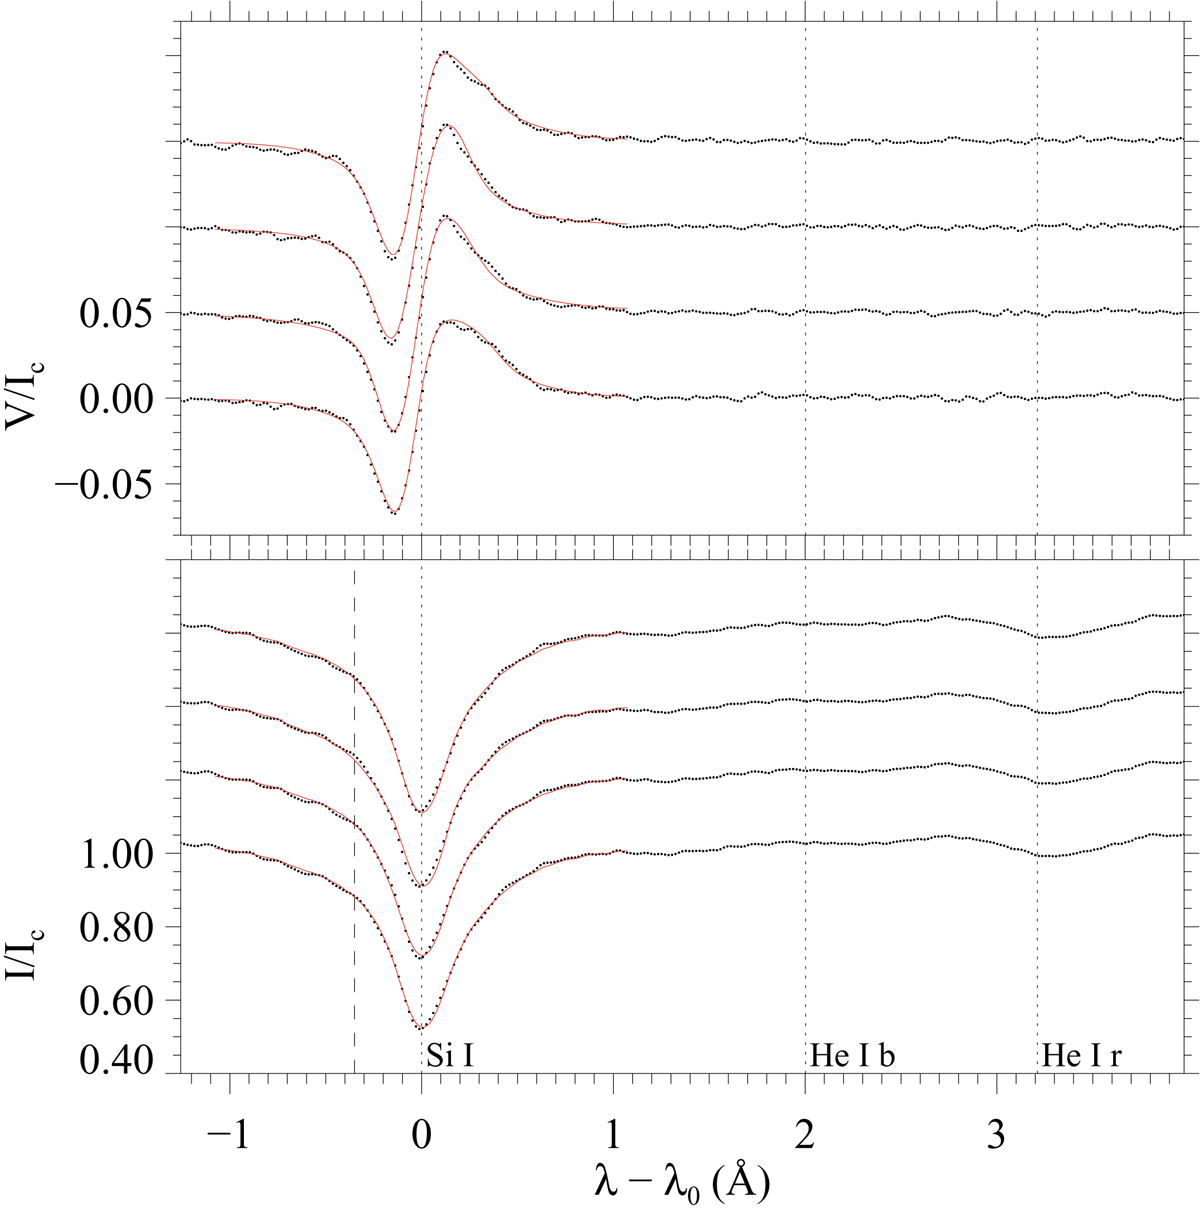
Four Stokes V/Ic profiles with the largest amplitude belonging to BP (b), and their corresponding Stokes I/Ic profiles. The various Stokes I (V) profiles are shifted by +0.20 (+0.05) along the y-axis or ordinate. The wavelength axis is centered at the Si I line at rest. The red line shows the best fit obtained from the SIR inversion. The dotted vertical lines show the positions at rest of Si I and of the blue (He I b) and red (He I r) components of He I. The dashed vertical line indicates Si I λ0 − 0.35 Å, which corresponds to the image shown in the lower right corner of Fig. 1.
Current usage metrics show cumulative count of Article Views (full-text article views including HTML views, PDF and ePub downloads, according to the available data) and Abstracts Views on Vision4Press platform.
Data correspond to usage on the plateform after 2015. The current usage metrics is available 48-96 hours after online publication and is updated daily on week days.
Initial download of the metrics may take a while.