Fig. 8
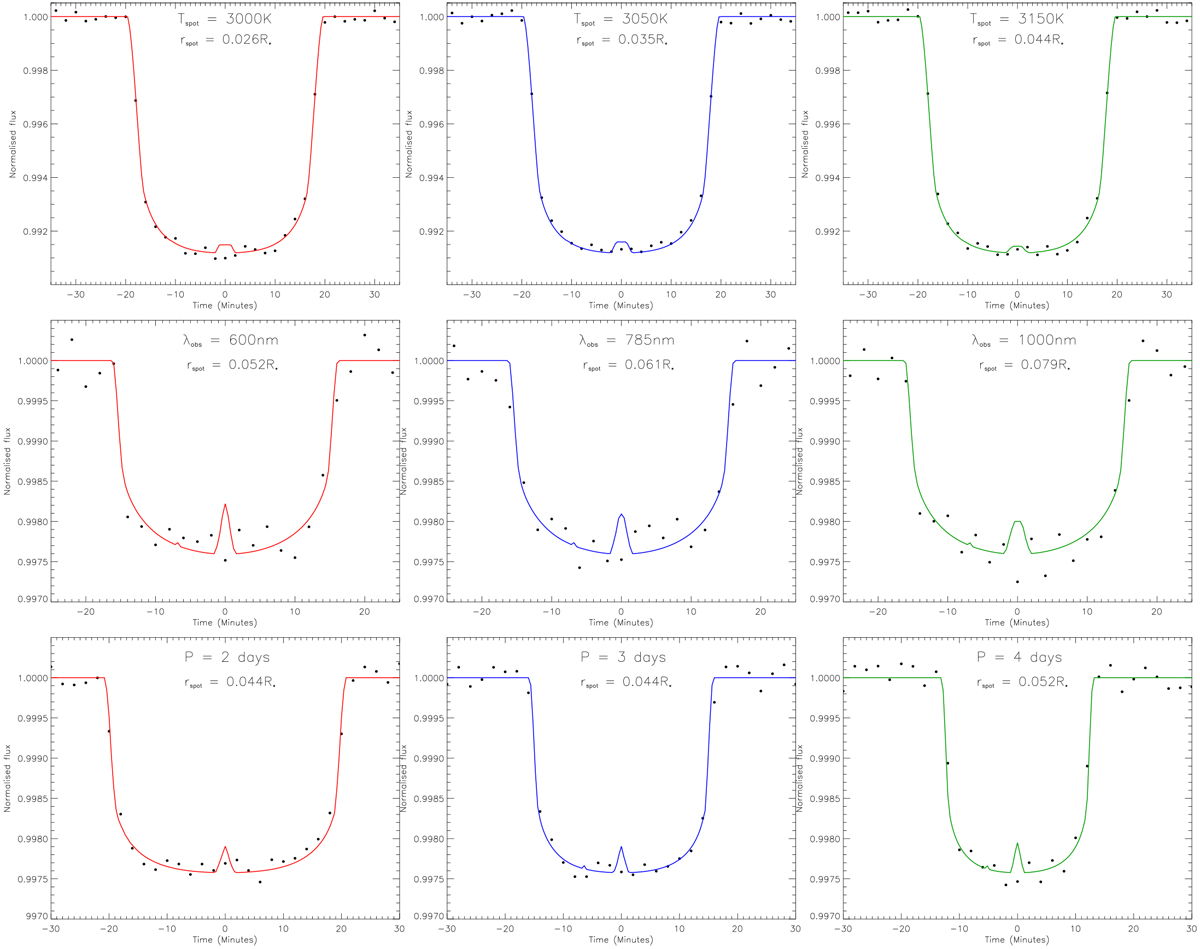
Ninesimulated transit light curves generated by PRISM, showing the smallest detected starspot for 3 trends, Teff: top row; λobs: middle row; P: bottom row. Top row: simulations of a 1.5 R⊕ super-Earth planet transiting a 3200 K, 0.155 R⊙ M4V dwarf star with i = 90.0°, P = 1 d, λobs = 600 nm, and rms scatter 150 ± 7.5 ppm. Each column on the top row shows a different Tspot, where Tspot = 3000, 3050, and 3100 K (left to right). The smallest detected rspot are rspot = 0.026R* (red), rspot = 0.035R* (blue), and rspot = 0.044R* (green). Middle row: simulations of a 3.0 R⊕ Neptune-sized planet transiting a 4100 K, 0.623 R⊙ K5V dwarf star with i = 90.0°, P = 4 d, Tspot = 3900 K, and rms scatter 200 ± 10 ppm. Each column on the middle row shows a different λobs, where λobs = 600, 785, and 1000 nm (left to right). The smallest detected rspot values are rspot = 0.052R* (red), rspot = 0.061R* (blue), and rspot = 0.079R* (green). Bottom row: simulations of a 2.25 R⊕ sub-Neptune planet transiting a 3700 K, 0.493 R⊙ M1V dwarf star with i = 90.0°, Tspot = 3550 K, λobs = 1000 nm and rms scatter 100 ± 5 ppm. Each column on the bottom row shows a different P, where P = 2 d, 3 d and 4 d (left to right). The smallest detected rspot are rspot = 0.044R* (red), rspot = 0.044R* (blue), and rspot = 0.052R* (green). The solid lines represent the noise-free synthetic light curves containing the starspot anomaly, while the filled circles represent the spot-free synthetic light curves (see Sect. 3) with added Gaussian noise.
Current usage metrics show cumulative count of Article Views (full-text article views including HTML views, PDF and ePub downloads, according to the available data) and Abstracts Views on Vision4Press platform.
Data correspond to usage on the plateform after 2015. The current usage metrics is available 48-96 hours after online publication and is updated daily on week days.
Initial download of the metrics may take a while.