Fig. 7
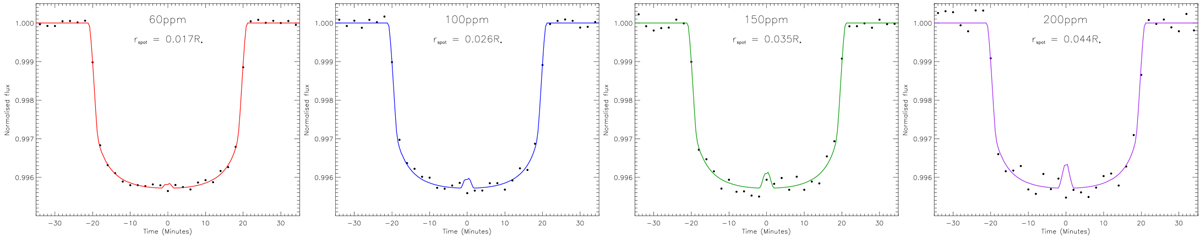
Four simulated transit light curves generated by PRISM. The observational wavelength of the simulated transits was 785 nm. These were generated using a 3.0 R⊕ sub-Neptune planet transiting a 3700 K, 0.493 R⊙ M1V dwarf star with i = 90.0° and P = 2 d. The starspotproperties were set at θ = 0°, ϕ = 90° and Tspot = 3475 K. The rms scatter of the light curves from left to right are 60, 100, 150, and 200 ppm. Each light curve shows the smallest detectable starspot size for the scenarios, 0.017R* (red), 0.026R* (blue), 0.035R* (green), and 0.044R* (purple), which increases with increasing noise. The solid lines represents the noise-free synthetic light curves containing the starspotanomaly, while the filled circles represent the spot-free synthetic light curves (see Sect. 3) with added Gaussian noise.
Current usage metrics show cumulative count of Article Views (full-text article views including HTML views, PDF and ePub downloads, according to the available data) and Abstracts Views on Vision4Press platform.
Data correspond to usage on the plateform after 2015. The current usage metrics is available 48-96 hours after online publication and is updated daily on week days.
Initial download of the metrics may take a while.