Fig. 4
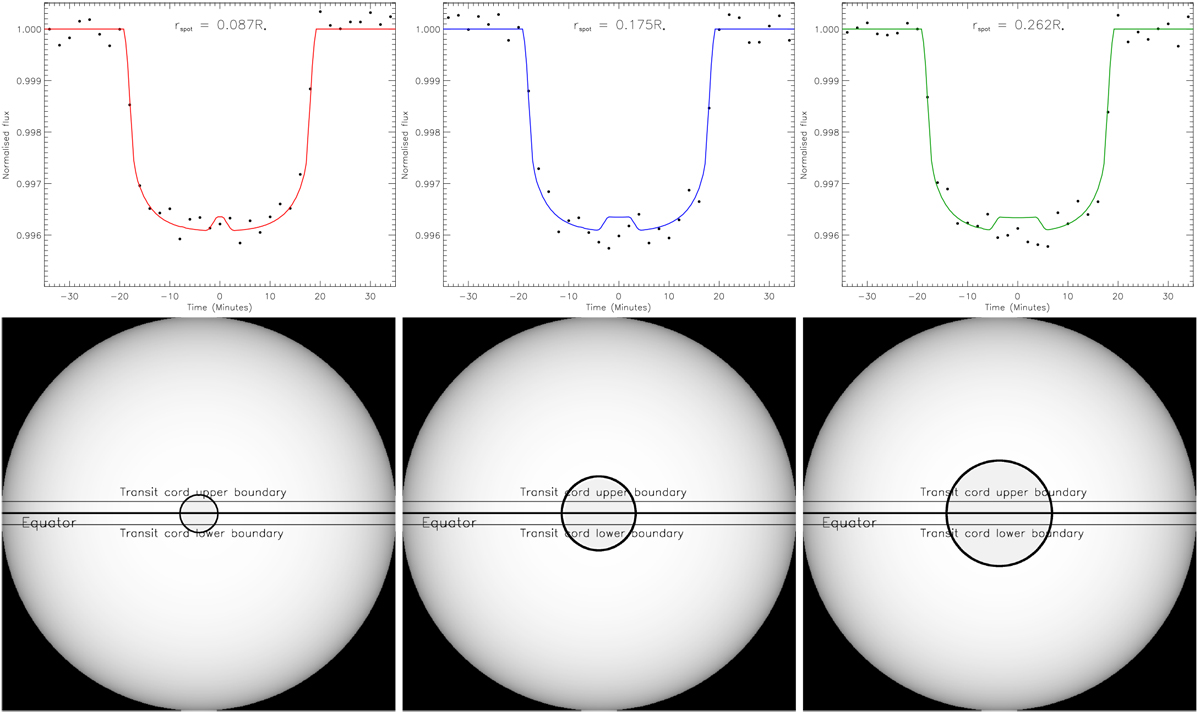
Three simulated transit light curves (top panels) and stellar disc outputs (bottom panels), generated by PRISM. Light curves: the solid lines represent the noise-free synthetic light curves containing the starspot anomaly, while, the filled circles represent the spot-free synthetic light curves (see Sect. 3) with added Gaussian noise. Stellar discs: the central solid lines represents the stellar equator (assuming orbital alignment) and the upper and lower solid lines represent the upper and lower boundaries of the transit cords. Because the high ρspot, the starspot boundary is highlighted with a black circular boarder. The observational wavelength and rms scatter for the simulated transits are set at 1000 nm and 200 ppm, respectively. These were generated using a 1.0 R⊕ Earth-sized planet transiting a 3200 K, 0.155 R⊙ M4V dwarf star with i = 90.0° and P = 1 d. The starspotproperties were set at θ = 0°, ϕ = 90° and Tspot = 3150 K (ρspot = 0.93). Left panels: rspot = 0.087R*, middle panels: rspot = 0.175R*, right panels: rspot = 0.262R*.
Current usage metrics show cumulative count of Article Views (full-text article views including HTML views, PDF and ePub downloads, according to the available data) and Abstracts Views on Vision4Press platform.
Data correspond to usage on the plateform after 2015. The current usage metrics is available 48-96 hours after online publication and is updated daily on week days.
Initial download of the metrics may take a while.