Fig. 10
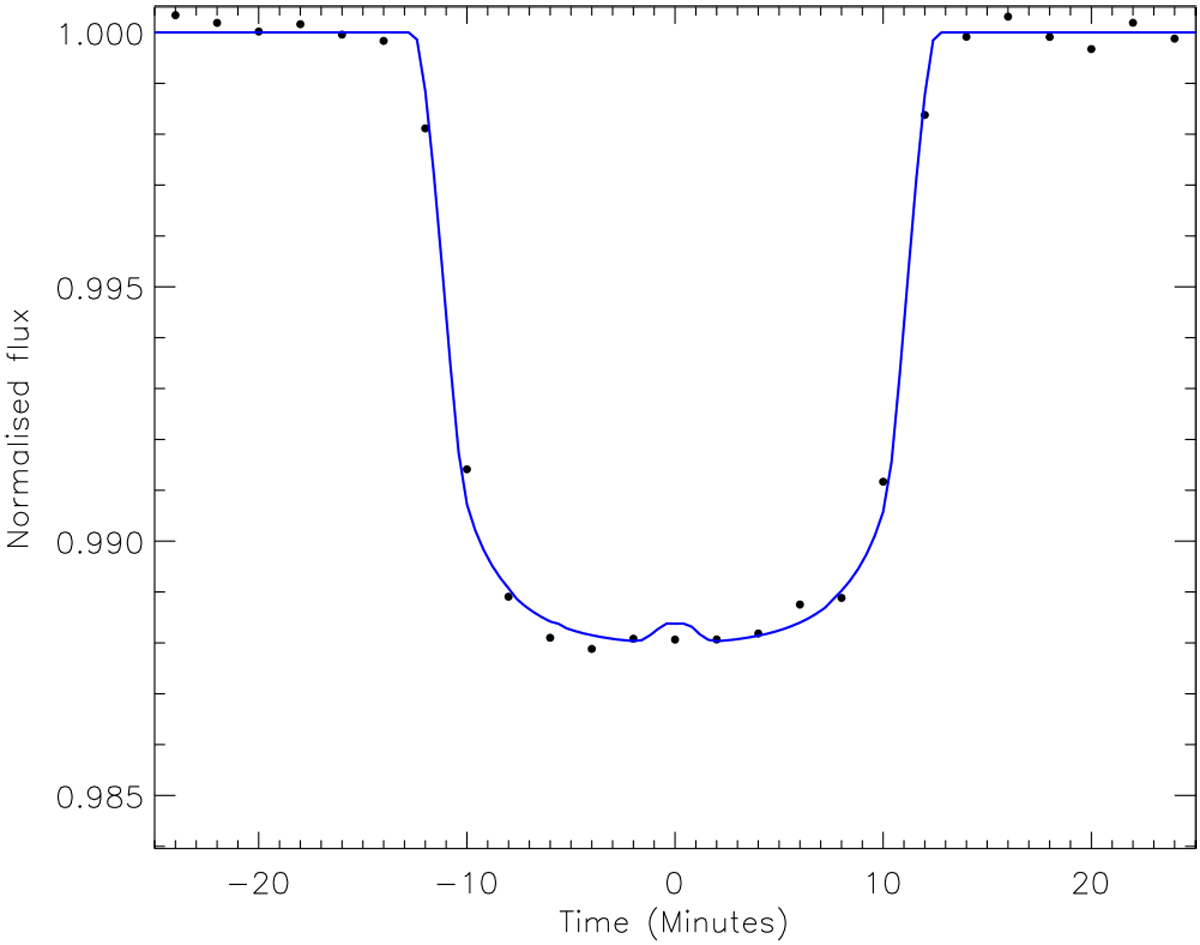
Example of multiple data points describing the plateau of a starspot anomaly. Using a 1.75 R⊕ super-Earth planet transiting a 3200 K, 0.155 R⊙ M4V dwarf star with i = 90.0° and P = 2 d. The starspot properties are θ = 0°, ϕ = 90°, rspot = 0.061R*, and Tspot = 3150 K. The observational wavelength and rms scatter for the simulated data were set at 785 nm and 200 ± 10 ppm, respectively. The solid line represents the noise-free synthetic light curve containing the starspot anomaly, while the filled circles represent the spot-free synthetic light curve (see Sect. 3) with added Gaussian noise.
Current usage metrics show cumulative count of Article Views (full-text article views including HTML views, PDF and ePub downloads, according to the available data) and Abstracts Views on Vision4Press platform.
Data correspond to usage on the plateform after 2015. The current usage metrics is available 48-96 hours after online publication and is updated daily on week days.
Initial download of the metrics may take a while.