Fig. 8.
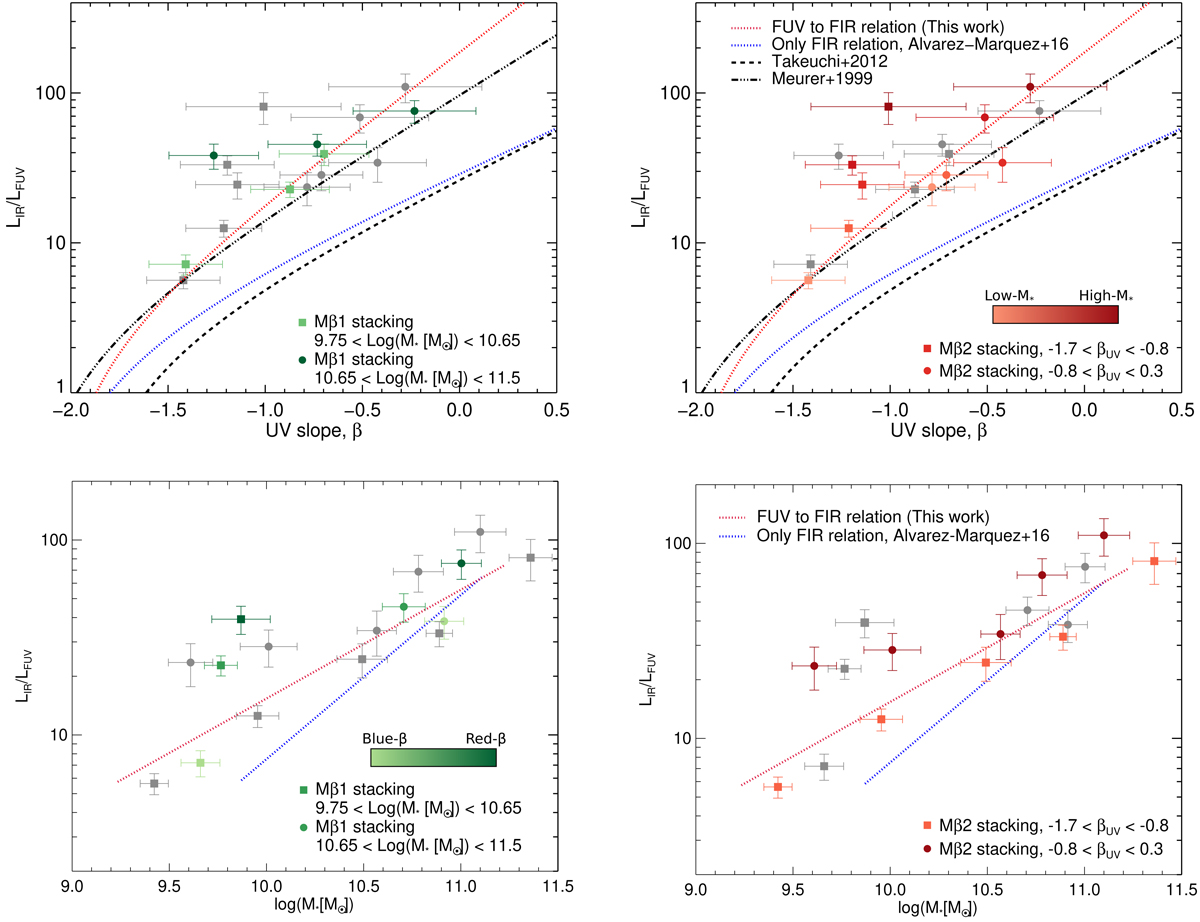
LBG-Mβ1 and LBG-Mβ2 results in the IRX–βUV (top panels) and IRX–M* (bottom panels) planes. Top left panel: LBG-Mβ1 are shown in green; the tonalities represent the two different bins in M*, 9.75 < log(M* [M⊙]) < 10.65 (light green filled square) and 10.65 < log(M* [M⊙]) < 11.5 (dark green filled circles). Top right panel: LBG-Mβ2 results are shown in red; the tonalities represent the increase of the M* from 9.75 (light red) to 11.50 (dark red). The filled squares represent the bluer βUV bin and the filled circles the redder βUV bin. Bottom left panel: LBG-Mβ1 are shown in green; the tonalities represent the increase of the βUV from −1.7 (light green) to 0.5 (dark green). The filled squares represent the low M* bin and the filled circles the high M* bin. Bottom right panel: LBG-Mβ2 results are shown in red; the tonalities represent the two different bins in βUV, −1.7 < βUV < −0.5 (light red filled square) and −0.5 < βUV < 0.5 (dark red filled circles). The gray points in all diagrams represent the LBG-Mβ results that are not highlighted in color.
Current usage metrics show cumulative count of Article Views (full-text article views including HTML views, PDF and ePub downloads, according to the available data) and Abstracts Views on Vision4Press platform.
Data correspond to usage on the plateform after 2015. The current usage metrics is available 48-96 hours after online publication and is updated daily on week days.
Initial download of the metrics may take a while.