Fig. 7.
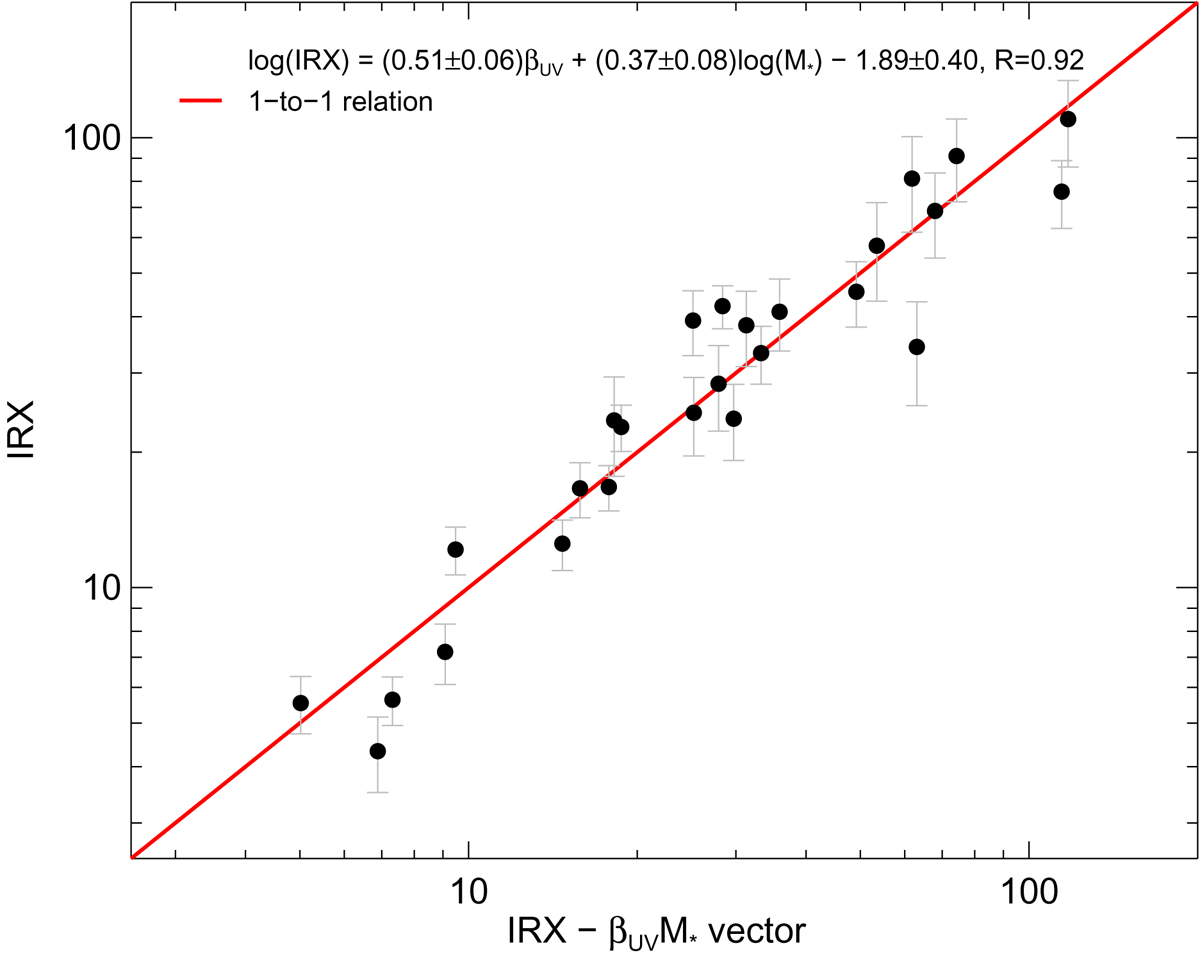
Empirical IRX calibration by combination the βUV and M*. The plane fit in the 3D IRX–βUV − M* diagram provides us with the equation log(IRX)=(0.51 ± 0.06)βUV + (0.37 ± 0.08)log(M* [M⊙]) − 1.89 ± 0.40, which can be used to correct the dust attenuation when βUV and M* are known. The y-axis corresponds to the IRX obtained from SED-fitting analysis over the stacked LBGs SEDs. The x-axis corresponds to the IRX calculated from the plane fit equation. The black points indicate the results from the SED-fitting and stacking analysis as a function of βUV and M*, and the combination of the two (LBG-β, LBG-M, LBG-Mβ1, and LBG-Mβ2). The red line indicates the 1-to-1 relation.
Current usage metrics show cumulative count of Article Views (full-text article views including HTML views, PDF and ePub downloads, according to the available data) and Abstracts Views on Vision4Press platform.
Data correspond to usage on the plateform after 2015. The current usage metrics is available 48-96 hours after online publication and is updated daily on week days.
Initial download of the metrics may take a while.